A Case for GeoJSON-T

GeoJSON has become a popular standard format for representing geographic features in web mapping applications. It is supported by the key JavaScript libraries Leaflet, Mapbox, OpenLayers, and D3, and to some extent by desktop GIS software (QGIS, ArcMap). GitHub renders valid GeoJSON as simple maps, and web-based utility applications like geojson.io and GeoJSONLint help users create, edit and validate it.

As the name suggests, GeoJSON-T adds time to GeoJSON. Geographic features, defined broadly[1], include events we want to map and analyze (e.g. births, deaths, battles, journeys, publication). For many analyses and mapping tasks, the temporal attributes of geographic features are as important as their geometry. Furthermore, many non-eventive geographic features–settlements, polities, buildings, monuments, earthworks, archaeological finds and so on–have essential temporal attributes.

linkedplaces-screen
Figure 1 – Xuanzang’s 7c pilgrimage in Linked Places demo

It is hardly controversial that a great many natural and fictional phenomena have a relevant spatial and temporal coverage (cf. Dublin Core), or setting.[2] Shouldn’t the de facto standard for geographic feature data account for time?

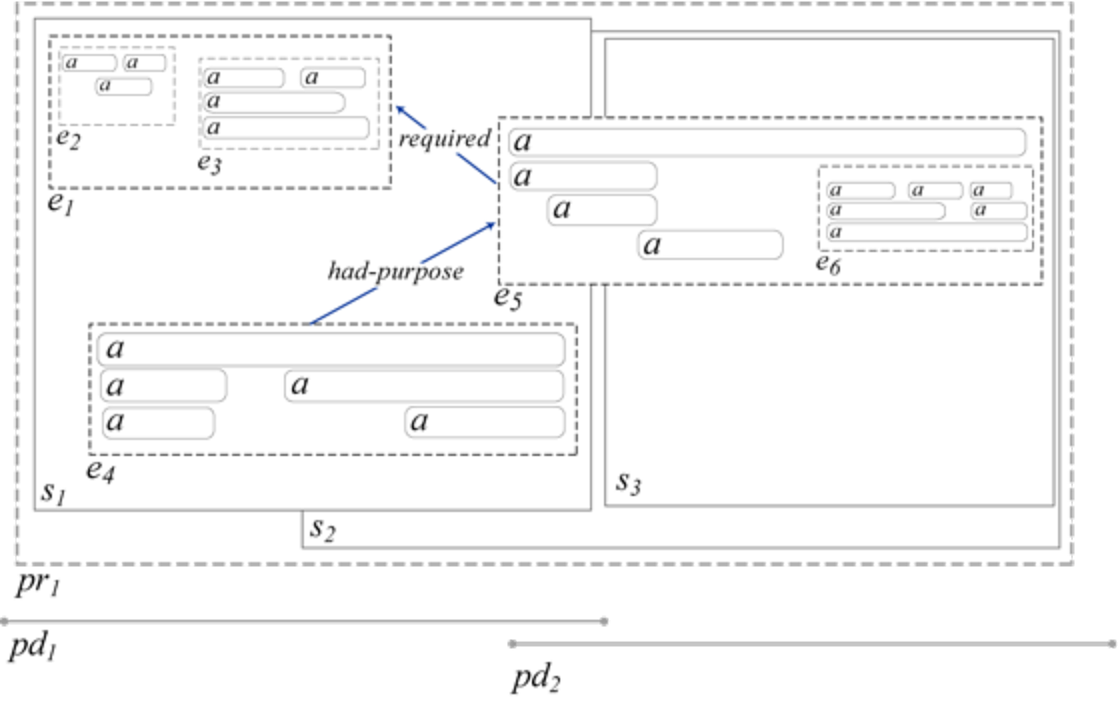
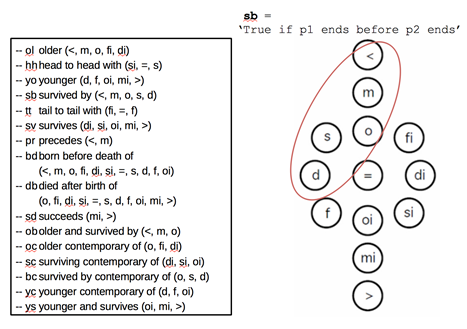
It could be (and has been) argued that time can be added to a GeoJSON feature as a member of its “Properties” element, organized however one sees fit. Certainly true, and many have. At issue is whether there should be a simple accepted standard location and format for temporal information within a GeoJSON Feature. If there were, a) new software, or new versions of existing software, could parse those temporal elements and render them to timeline visualizations[3], and b) data from multiple projects could be linked and analyzed by means of period assertions or computed “temporal topology” (e.g. Allen’s interval algebra[4]: equals, overlaps, before, after, starts, finishes, meets).

How would this work?

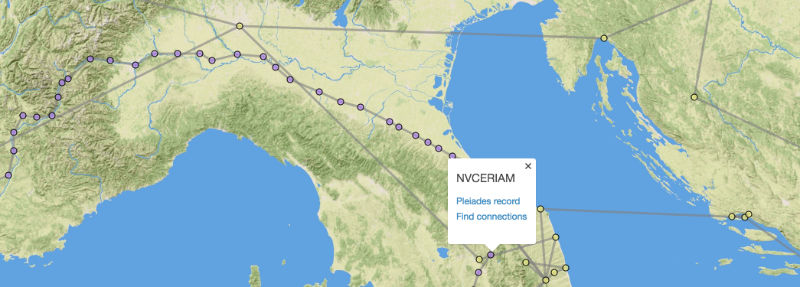
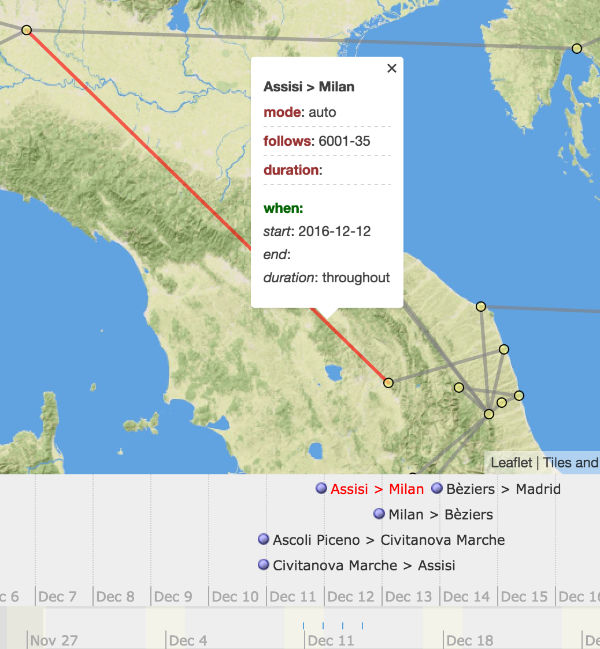
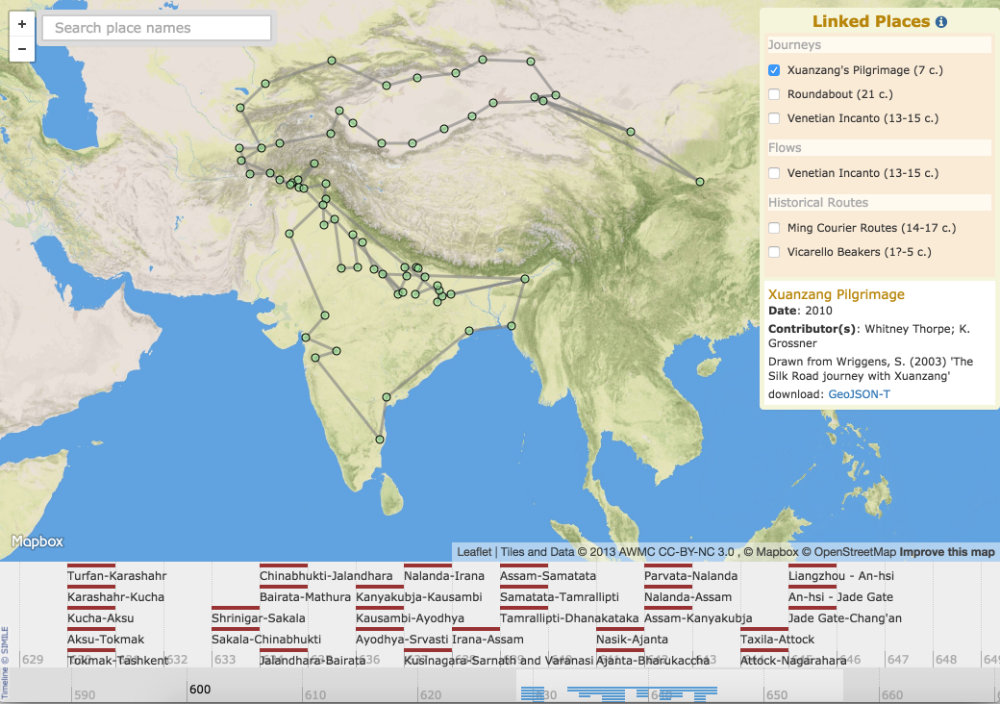
The first conceptual step is a simple matter: wherever a “geometry” element is required in GeoJSON, an optional adjacent (sibling) “when” element is allowed. Existing software supporting GeoJSON would simply ignore these and function normally. New software, or new versions of existing software, would parse them and offer visualization and analytic functionality. In the Linked Pasts demo prototype, I render “when” elements to a timeline using the venerable if outdated Simile Timeline library, linked to the “geometry” elements rendered traditionally to a Leaflet map (Figure 1).

Developing a standard

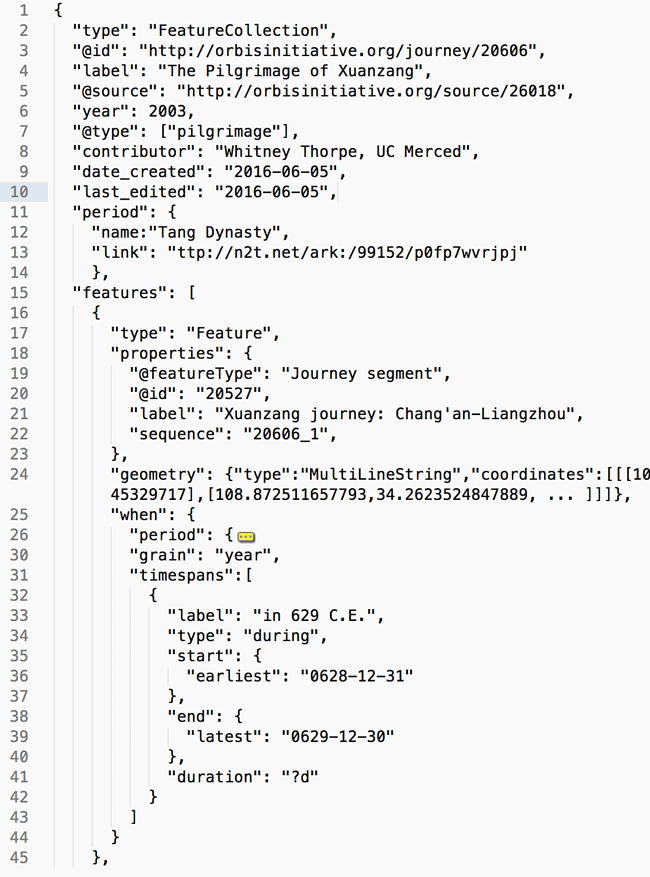
It’s well and good to say, “wherever there’s a ‘geometry’ allow an optional ‘when’,” but the devil is in the details. What is required and allowed in that “when?” I’m not experienced at ringleading standards development; what I’ve done for starters is create a provisional standard for discussion, then made the aforementioned demo app as proof-of-concept. The “when” looks like this:

"when": {
  "timespans": [["-323-01-01 ","","","-101-12-31",
     "Hellenistic period"]],
  "duration": "?",
  "periods": [{
    "name": "Hellenistic Period",
    "period_uri": " http://n2t.net/ark:/99152/p0mn2ndq6bv"
 }],
  "follows": "<feature or geometry id>",
}

An explanation of each element:

When

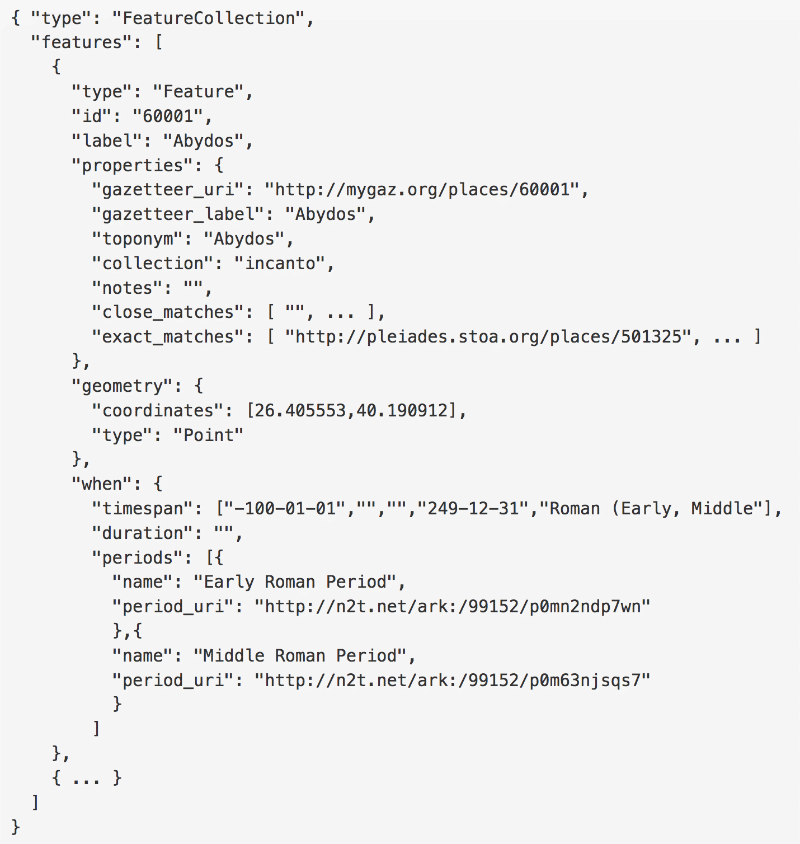
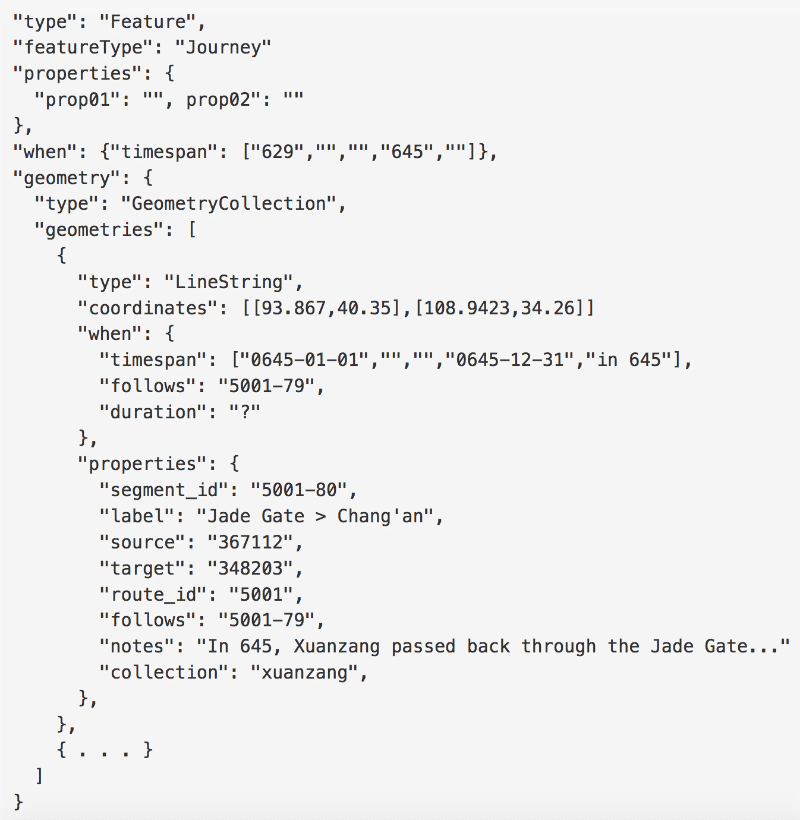
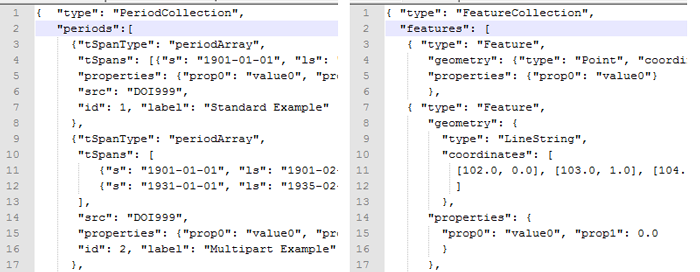
Optional. A sibling of “geometry” in a Feature (a), or of “coordinates” in a member of a GeometryCollection (b)

(a)

{
"type": "FeatureCollection",
"features": [
 {
 "type": "Feature",
 "id": "",
 "properties": {},
 "geometry": {},
 "when": {}
 }
]
}

(b)

"geometry": {
 "type": "GeometryCollection",
 "geometries": [
   {
    "type": "LineString",
    "coordinates": [[93.867,40.35],[108.9423,34.26]],
    "when": {}
   }
 ]
}

Timespans

Required. An array of one or more 5-part arrays, the positions of which are Start, Latest Start, Earliest End, End, Label. Of these, only Start is required. The first 4 positions accept any ISO-8601 temporal expression, with the ‘accepted convention’ of a minus sign for BCE years. Label is an optional short text string that would (presumably) appear alongside a visual representation of the timespan.
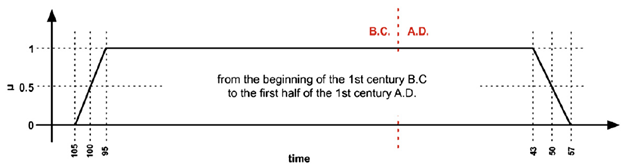
Duration

Required. A null value indicates the phenomena occurred (or was valid) throughout the feature’s Timespans. If it occurred only for some part of it/them, enter an integer followed by a single letter code for the increment (d=days; m=months; y=years) or a “?” for an unknown duration. For example, a weeklong festival at some unknown time within a year timespan would be indicated as “duration”:”7d”; a birth as (perhaps) “duration”:”1d”

I anticipate timeline visualizations will be find this distinction essential; a birth for example does not occur throughout a year.

Periods

Optional. An array of Period objects defined in an external period gazetteer (e.g. PeriodO, each with a “name” and “period_uri” that can be dereferenced dynamically.
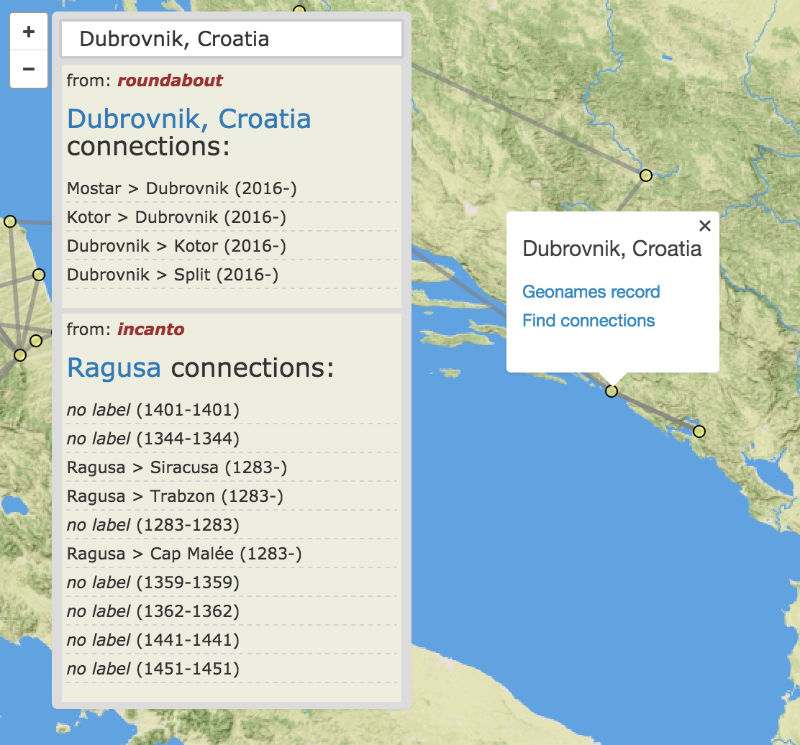
Follows

Optional. If the Feature or GeometryCollection member is in a meaningful sequence, enter the internal identifier of the element it follows here. Software indicating order or directionality visually or in lists will make use of these values if present.

Next Steps

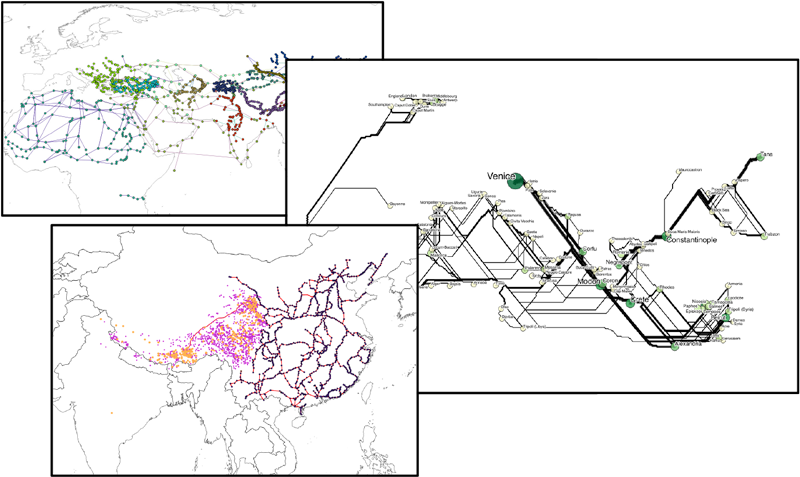
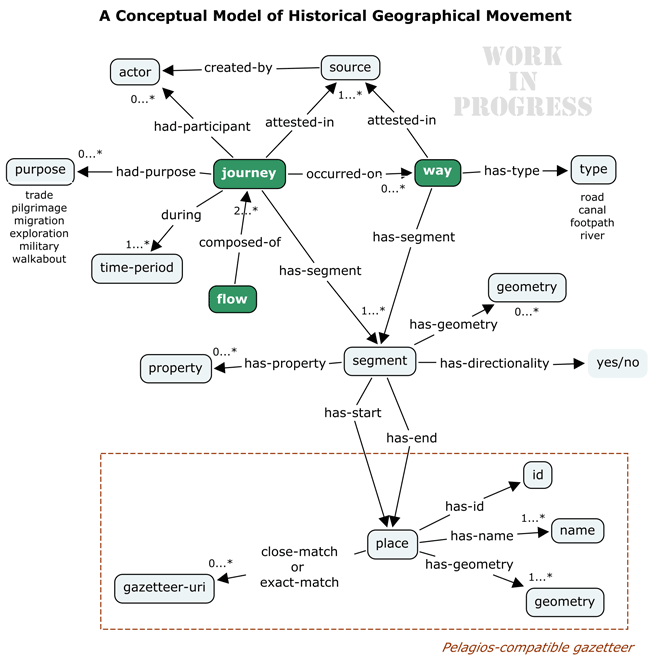
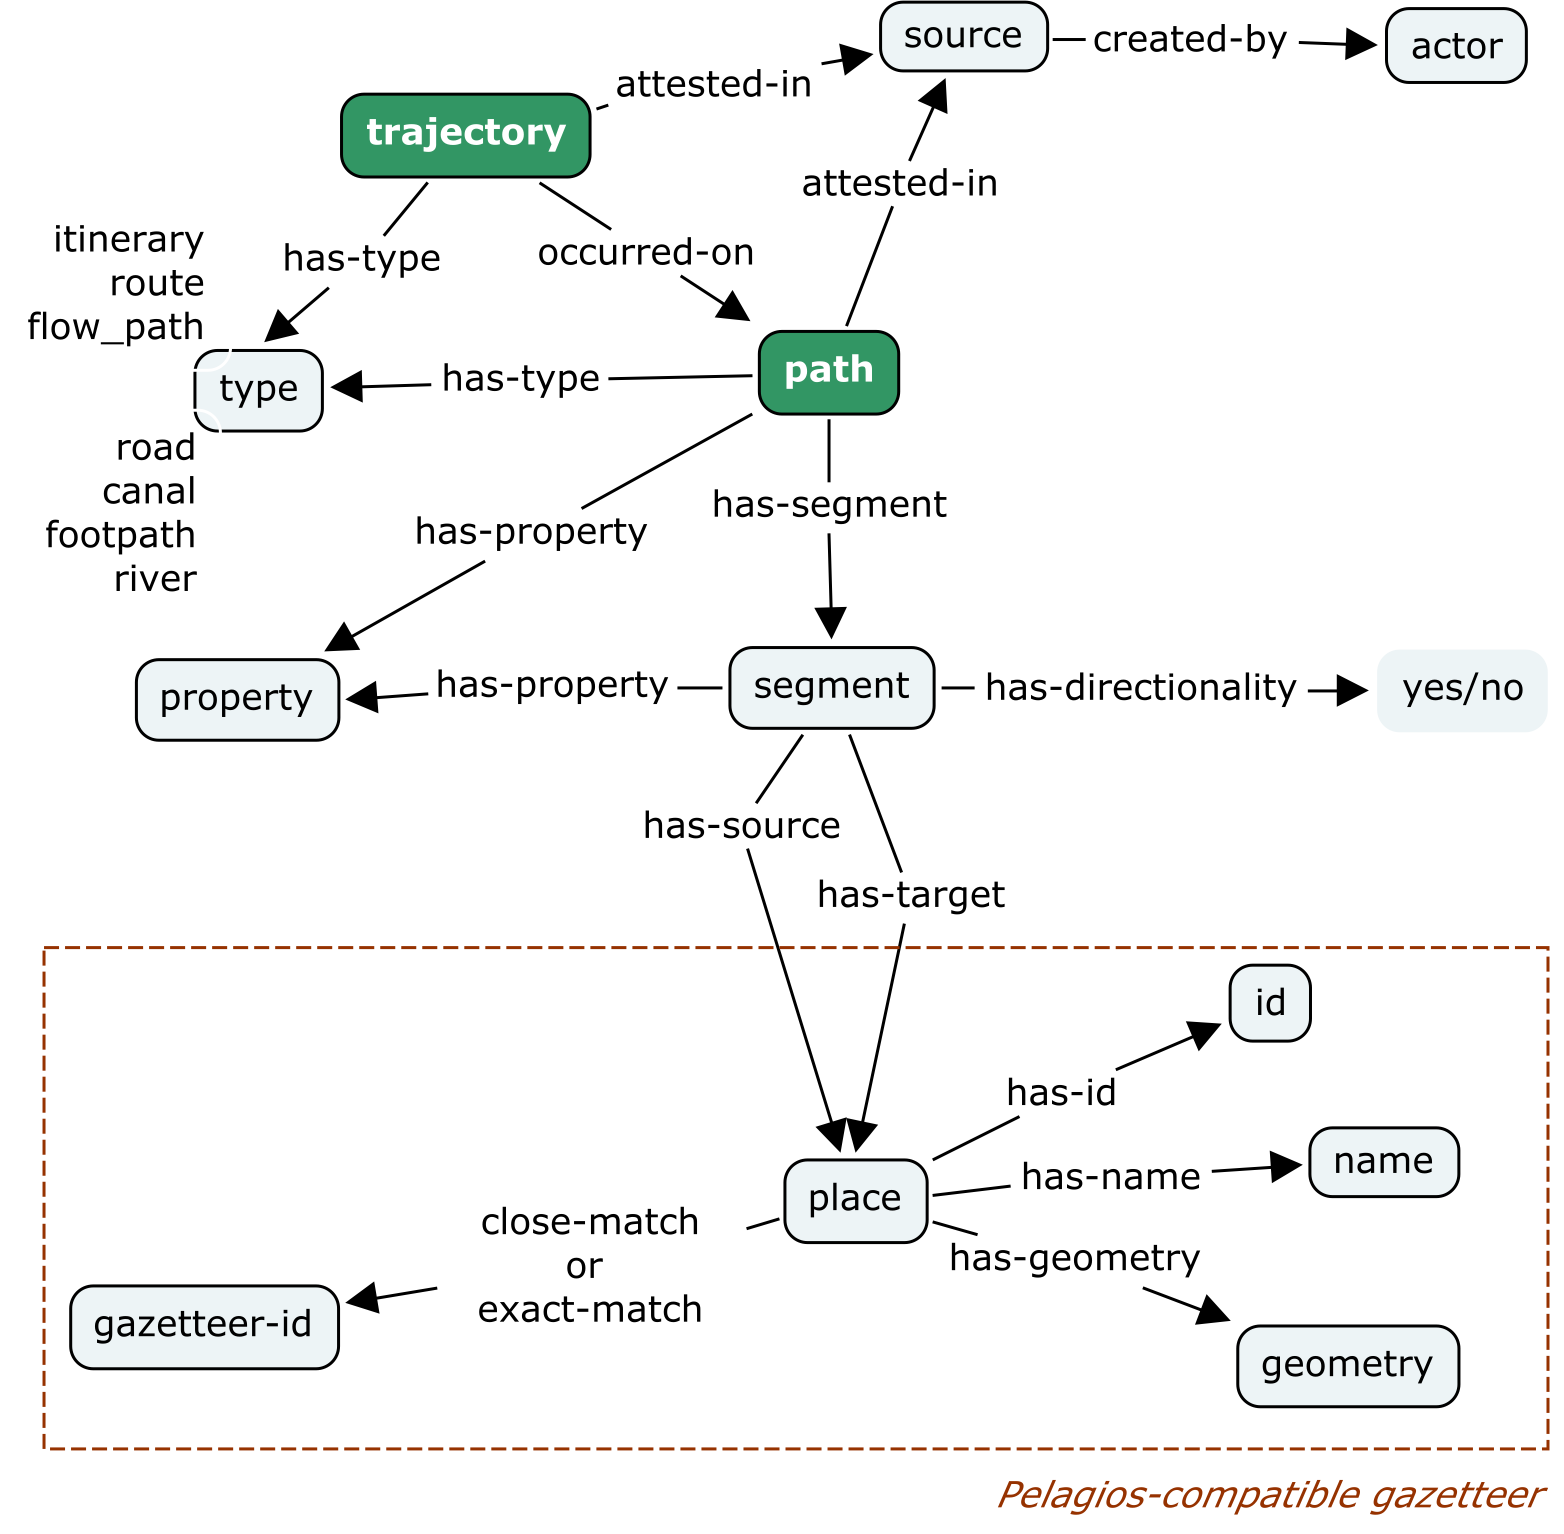
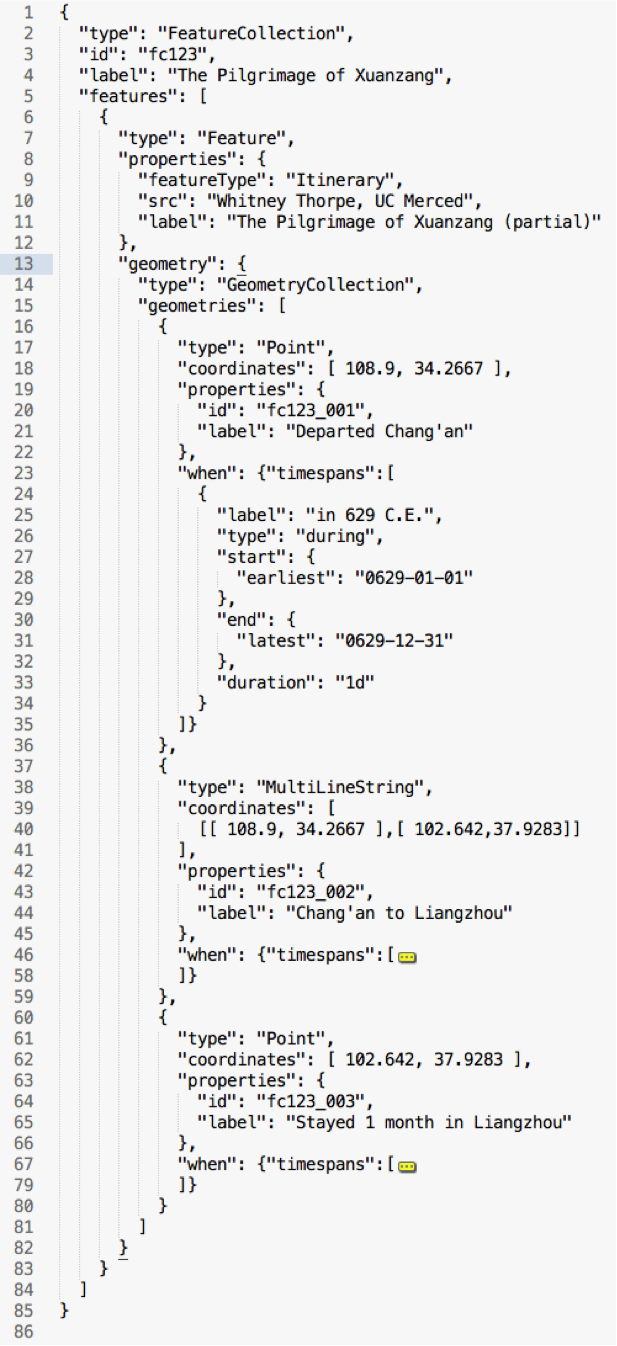
I’d like to move the development of GeoJSON-T into a more formal process, but perhaps that should follow more informal discussion. A more detailed explanation of GeoJSON-T and its implementation for data about historical movement — journeys, flows and named routes — appears in the Topotime GitHub repo.

Please let me know your views on how we might proceed, by twitter (@kgeographer) or as a GitHub issue or preferably both. In the meantime, I will continue converting exemplar datasets into the provisional format outlined here, and developing software and utility scripts to manage, display, and even analyze it.

[1] A GIScience-ish definition for geographic features: “Phenomena on or near the earth surface for which location and other spatial attributes are integral for understanding and analysis.”

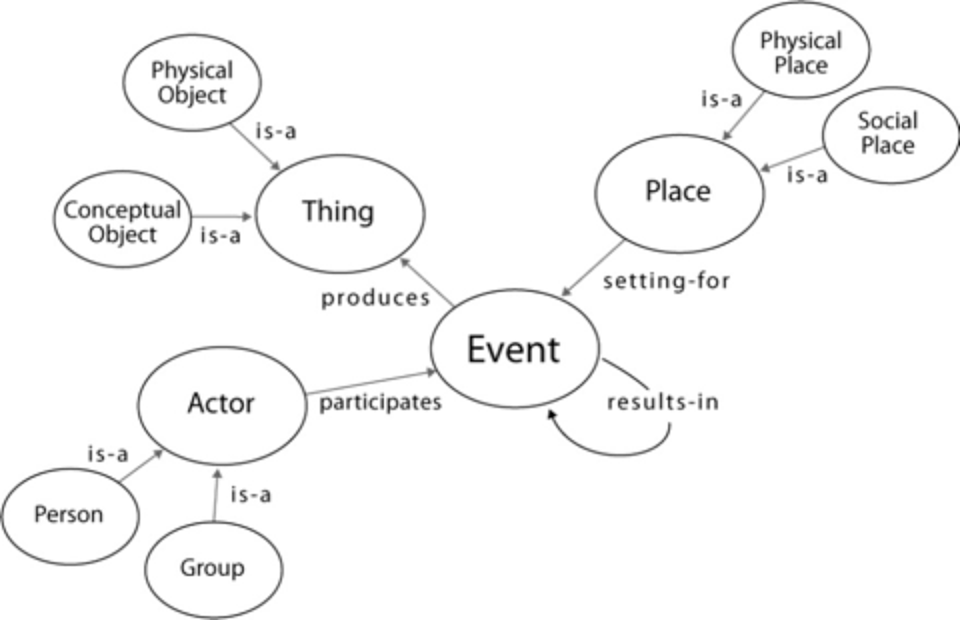
[2] An ontology design pattern for Setting was proposed in Grossner, K., Janowicz, K. and Keßler, C. (2016). The Place of Linked Data for Historical Gazetteers. In R. Mostern, H. Southall, and M.L. Berman (Eds.). Placing Names: Enriching and Integrating Gazetteers. Bloomington: Indiana University Press.

[3] As I have begun demonstrating with Linked Places work (http://topotime.org/linkedplaces)

[4] https://en.wikipedia.org/wiki/Allen’s_interval_algebra

Linking Linked Places

lp-banner
Screenshot from demo web map/timeline app

NOTE: This project has been subsequently renamed, now titled “Linked Paths.”

A little context

The tag line for the Pelagios Commons web site is, “Linking the Places of our Past,” and that project is indeed facilitating the linking of historical place attestations published in digital gazetteers. From my perspective (and many others’) , the initiative is going great, bravo!

There are other ways that places are or have been linked and I’ve been plugging away at a facilitating representations and analysis of those connections in a couple of ways. The first was The Orbis Initiative, an ambitious and sadly unsuccessful NSF grant proposal to develop software and systems for extracting information about roads, rivers, canals, railways, and footpaths–and the places connected by them–from the million or so high-quality scans of historical maps. That data is of the physical channels (a.k.a. media, ways) used for the movement of people and goods across the earth surface. Although the grant wasn’t awarded, I’m happy to say a manageably-sized portion of the work it described was taken up by the CIDR team at Stanford University Libraries, just as I was leaving (amicably) in September. I expect fantastic results!

Since that work on geographic networks is in such good hands, I’ve begun to focus on the other side of that coin, the movement over such networks: individual journeys, named historical routes and route systems, and flows. I’m calling the project Linked Places (GitHub repository), and a mini-grant from Pelagios Commons has helped to jump-start it. It’s part of my larger DH/GIScience research frame, Topotime, which has a broad goal of joining Place and Period in data stores and software for historical research and education.

Enough context, this blog post is intended to describe the status of the Linked Places work products.

Linked Places Phase Two Status

I’ve described the goals of Linked Places and its early results in two blog posts on Pelagios Commons earlier this year (July and October respectively). In Phase One, Lex Berman and Rainer Simon joined me in clarifying a conceptual model for what we wanted to do, refining a provisional spec for a GeoJSON temporal extension (GeoJSON-T), then adapting the GeoJSON-T format for representing route data. We agreed on the term route for an overarching class encompassing journeys, flows, and historical routes and route systems (hRoutes). The conceptual model was then “expressed” in the GeoJSON-T form (Figures 1 and 2).

In Phase Two, I holed up in beautiful Ascoli Piceno to a) convert five exemplar data sets to a generic CSV form, b) write Python scripts to transform that CSV to GeoJSON-T and to populate an ElasticSearch index, and c) build a demo web map application that consumes GeoJSON-T data and puts it through some paces. That app, which mashes up Leaflet/Mapbox map with a Simile Timeline, is not designed as such–it’s been thrown together for discussion about what real apps might be interesting. I will be presenting this now completed Phase 2 work at the Linked Pasts workshop in Madrid, 15-16 December 2016.

Linked Places Work Products

GeoJSON-T

GeoJSON-T simply adds an optional “when” element to native GeoJSON. That “when” is typically placed at the same level as a “geometry” element (the “where”), which can appear in a couple of places: as a top-level attribute of a Feature (Figure 1), or, in the case of routes data, as a member of a GeometryCollection (Figure 2). The GeoJSON GeometryCollection is a relatively infrequently used construct, but is essential to how we represent journeys and hRoutes. There is some more explanation on the Github wiki.

Figure 1. Generic GeoJSON-T Feature, with “when” member in a FeatureCollection (simplified gazetteer record)

geojson-t_syntax02

Figure 2. Route feature (featureType Journey); segments are geometries in GeometryCollection

geojson-t_syntax01

Scripts

I’ve made the assumption that a large proportion of historical route data will be developed in spreadsheet or CSV format natively. Attributes and coding terminology will of course be distinct for every project that develops data. There’s nothing to stop anyone from creating GeoJSON-T route data from scratch, by whatever means, but if a researcher can rearrange their CSV data in a standard form, it can be converted and ingested automatically for use in the existing demo or future GeoJSON-T compatible applications.

At present, one would need to create two CSV files, one for places, and one for route segments. The core fields that are required, but in cases can have null values, are:

PLACES:

[‘collection’, ‘place_id’, ‘toponym’, ‘gazetteer_uri’, ‘gazetteer_label’, ‘lng’, ‘lat’]

ROUTE SEGMENTS:

[‘collection’, ‘route_id’, ‘segment_id’, ‘source’, ‘target’, ‘label’, ‘geometry’, ‘timespan’, ‘duration’, ‘follows’]

Following these, data files can have any number of further attributes/columns, which will appear in various ways within any given app. A complete accounting of these fields, and further details about data preparation and the Python conversion/ingestion scripts (csvToGeoJSON-T.py and elastic.py) will appear on the GitHub repository wiki soon. If you are anxious to play with this stuff before then (or afterwards), get in touch with me directly.

Linked Places Demo App

The GeoJSON-T format and its implementation for route data allows for some interesting display and analysis possibilities. The app so far only explores the visualization side. I’m planning to follow up this work with at least two “real” applications that do more: one for data exploration and discovery across a large distributed corpus/repository, and a second that allows manipulation and analysis of a given network of geographic movement (e.g. commodity flows like Incanto Trade, or route systems like the Ming Courier Routes). I’ve identified a few other exemplar datasets and welcome inquiries for collaboration.

Features

Load one or more datasets; view linked gazetteer records for places; events or optionally “fuzzy” periods rendered on timeline

Linked Places screenshot 01

Search for Places, identify all members of its “conflation_of” set; and all route segments associated with it, from multiple datasets

Linked Places screenshot 02

Rudimentary timeline visualization (Simile Timeline); timeline and map features are linked

Linked Places screenshot 03

Load places and segments for flows and hRoute systems (nodes and links/edges) into D3 force-directed graph; download GeoJSON-T

screen capture, D3 graph visualization

View linked Place gazetteer data (Pleiades, TGAZ, Geonames)

lp-features_06

View linked Period gazetteer data (from Perio.do)

lp-features_05

Summary

The results of this work: a conceptual model for routes (journeys, flows and historical routes/route systems), the GeoJSON-T extension, its implementation for route data and reliance on CSV input, and last but not least the map/timeline mashup, are all provisional and experimental. The models have been tweaked (‘refined’) as requirements come to light, and that should continue for at least a little while longer. I welcome comments — here, on twitter (@kgeographer), via the project GitHub repo, or by email: karl[dot]geog[at]gmail[dot]com.


Event Centrality

I have been making a case for events in geo-historical information systems, periodically so to speak, over the past several years. Since I went “alternative-academic” (alt-ac) after completing my Geography PhD in 2010, I have neglected to publish material out of my dissertation—something I was cautioned strenuously against. I will begin rectifying that in bite-sized chunks on this blog; in time, maybe even write an article for an open access journal.

After nearly five years of building interactive scholarly works [1] others had in mind as a digital humanities research developer at Stanford, I’m moving on this Fall, and revisiting some of the things I was going on about in that dissertation. Oddly enough, I took a geography degree in order to better understand human history. Also odd perhaps is that I still like a lot of what I wrote.

It is titled “Representing Historical Knowledge in Geographic Information Systems,” and worth noting I was referring to (lower case, generic) geographic information systems, not GIS software packages like QGIS or ArcMap. Had no idea they were conflated so completely outside the discipline. Anyway, I began the introduction this way:

“The conceptual vehicle by means of which historians construct or analyze the contingency and temporal fatefulness of social life is the event. Historians see the flow of social life as being punctuated by significant happenings, by complexes of social action that somehow change the course of history.”

                                                                                                           (Sewell 2005:8)

Complex historical events are dynamic geographic phenomena: they comprise human activity associated with particular locations on the earth surface, and their participants’ locations and attributes over time are integral to their analysis.

Events are the central and most comprehensive container for information about dynamic geo-historical phenomena. To describe an event well is to account for its purpose and results, its participants’ roles in component activities during some interval, its setting in terms of space-time locations and relevant condition states, and its relation to other events, including as elements of historical processes.

The representation of large numbers of events along those dimensions will enable a powerful “faceted browsing” capability, and spatiotemporal analyses supporting the discovery of underlying processes. The power of events as information containers will stem in large part from typing them along their numerous dimensions.

After four chapters explaining my ontology engineering methodology and analyzing print historical atlases to discover some of what I called “the stuff of history,” in Chapter 5 I finally got around to elaborating the case and citing the articulate originators of CIDOC-CRM:

If we make a simple graph of the things in atlas maps—say events, people, material objects, and settings—we see the only object directly connected to all the others is the event. Virtually all relationships between persons, things and places are a function of, or mediated by, events (Figure 5-1).

Doerr and Iorizzo (2008) describe how its (CIDOC-CRM) event-centered approach permits “a picture of history as a network of lifelines of persistent items meeting in events in space/time […],” an “extraordinarily powerful” model supporting a “surprising wealth of inferences” (p. 5-8).   

figure_5.1

Figure 5.1 Event centrality


From that simple conceit, I went on to postulate that:

… just as physical objects are composed of one or more material substance, discrete temporal objects like events are composed of activity. At least it will be useful in the design of certain information systems to represent things as such, whether or not in actuality there is something in the temporal realm corresponding to matter in the physical realm.

Then I drew a slightly crazy figure to illustrate that notion (a = activity, e = events, pr = processes, pd = historical periods, s = states):

figure_5.2

Following that (skipping a step or two), I framed the engineering tasks to follow by enumerating six primitive “constructs” (I prefer “patterns” now) that are key elements of historical knowledge representation: Events and Participation; Place; Groups and Membership; Historical Periods; Historical Processes; and Attribution.

Not coincidentally, I’m finding that the research I’ve pursued since has focused on a few of these, which are interwoven when one approaches particular systems, such as historical gazetteer services and applications blending maps and timelines.

In particular a new (to me) pattern, of Setting merges Place and Historical Period has emerged in response to requirements of particular systems and applications. My work on Topotime is a result. I do think this is the way ontology design patterns are supposed to work: as modular and often connecting pieces expressing conceptual and theoretical bases for data models and interchange formats.

[1] Interactive Scholarly Works is a term I came up with back in the day, when Elijah Meeks and I worked out a taxonomy comprising Interactive Scholarly [Objects, Works, Publications] reflecting the range of things we were building at Stanford.

References

Doerr, M. & Iorizzo, D. (2008). The dream of a global knowledge network—A new approach. ACM Journal on Computing and Cultural Heritage 1(1): 5.1-5.23.

Sewell, W. H. (2005). Logics of history. Chicago: University of Chicago Press.


The Orbis Initiative: A Pelagios for Networks? [Take 2]

NOTE: This a “refresh” of the earlier post of the same title, edited to reflect some new terminology (indicated by red) and replace the conceptual model figure.

data-triptych

A small sampling of historical network datasets

I believe there would be widespread interest in a global collaboratively developed system, organized similarly to Pelagios, aimed at creating and linking data records for attested historical journeys (e.g. itineraries, and flows of people, commodities, information, correspondence) and ways (roads, rivers, canals, sea currents). In this provisional semantics, a journey is evidence of some person(s) or thing(s) moving from here to there (then there, etc.), at a known, approximate or estimated time and/or in a particular sequence, as attested in some source. A way is the physical medium for journeys.

Both journeys and ways can be represented as two or more places and one or more segments (nodes and edges in network parlance). Place nodes are necessarily “geographically embedded” and typically represented by feature centroids. The geometry of ways between nodes for various types of journeys may be known, estimated, or in the case of some flow data, of no concern.

Historical gazetteers in the Pelagios ecosystem represent only named places. Most are point-like features (e.g. settlements, sites); increasingly, polygonal features are included as well (e.g. regions, administrative areas). But what of historical movement—journeys between named places along ways? The simple data models used for the Pelagios interchange format and for most gazetteers do not accommodate journeys and ways.

Not surprisingly, the first early geographic document geo-parsed in Pelagios’ Recogito tool describes an itinerary: “Itinerarium Burdigalense: the Itinerarium Burdigalense (or Bordeaux Itinerary) […] a travel document that records a Pilgrim route between the cities of Bordeaux and Jerusalem.” Although we know each attested place was part of a traveled route, by virtue of its association with a text having “itinerarium” in its title, those relationships are not recorded formally in gazetteers, and therefore not readily discoverable and analyzable as routes and components of networks.

The Orbis Initiative

In February, 2015 I submitted a proposal to the National Science Foundation for a fairly large grant ($1.6m over 3 years) to develop the Orbis Initiative. Although reviews were quite positive, it was not funded. The project was designed to facilitate the creation, archiving, discovery, linking, and analysis of historical geospatial network data for “everywhere and every when” [1-page summary]. The project name was borrowed from an interactive scholarly web application I helped build, originally published by Stanford University Libraries in 2012 and significantly upgraded in 2014, ORBIS: The Stanford Geospatial Network Model of the Roman Empire (hereafter, ORBIS: Rome).

Whereas ORBIS: Rome is a model of travel and transport for a particular region and period aimed at answering the research questions of one Classical scholar, Walter Scheidel–and built by Scheidel and Elijah Meeks–the Orbis Initiative would instead be a system for creating, storing, and linking geospatial network data spanning potentially all places and periods—a distributed repository along with a set of relatively simple interactive web-based tools to facilitate its use. The design and proposed development of the Orbis Initiative is a response to researchers who have expressed a desire to build ORBIS: Rome-like applications for their own areas and periods of study. Importantly, the intent is not to expand the ORBIS: Rome network transport model, but to provide a generic data infrastructure and tools to facilitate development of other models and modeling approaches.

I remain convinced this would be a worthwhile undertaking and subsequently, two opportunities have emerged to begin some of the work described in the grant proposal, at a much smaller initial scale; I’ll discuss one of them here.

A Community of Interest?

Writing the Orbis Initiative grant entailed recruiting collaborators with varied exemplar datasets being developed for ongoing research. Several of those projects are concerned with processes of cultural diffusion and commercial activity—separately and in concert—in East and Central Asia and between Asia and Europe over extended periods. Their aggregated temporal extent is 7th century BCE to 16th century AD. Researchers in those groups, and now a few others, have indicated an immediate pragmatic interest in exposing and linking their data for common benefit. Meetings to discuss next steps have begun.

Something Like Pelagios

An Orbis Initiative would replicate several aspects of the Pelagios Project, which has gained terrific momentum in developing online resources, methods and software for linking historical gazetteers. I believe Pelagios’ success is due in large part to its “ground-up” nature—the fact it answers some immediate requirements of a distinct community of interest for the Classical Mediterranean. Its spatial and temporal extents and software tool development scope are growing organically, expanding upon smallish proofs-of-concept that people find useful. Tools developed so far facilitate data creation (Recogito) and data discovery (Peripleo). The Pelagios approach offers a stark contrast with some “build it and they will come” data repository projects attempted in recent years.

In the same vein, a pragmatic start to an Orbis Initiative could be seeded by meeting the requirements of the above-mentioned community of interest to link (and in a sense gather) their historical geospatial network data: connections by road, river, canal, and sea route between the places attested in Pelagios-compatible gazetteers.

A Conceptual Model

So, networks of journeys and flows are different in kind from place locations as commonly understood, and as such require a different, somewhat more elaborate data model. Furthermore, while all spatial data may include temporal attributes, some network data—itineraries for example—are inherently temporal; in fact they are events. Flows are essentially aggregated movement events.

In my experience a helpful first step in data modeling is to create a conceptual model of the entities and relations of what is being represented—an ontology design pattern if you will. Typically a collaborative undertaking, the resulting visualization provides a basis for the data schemas to follow, be they relational or graph. I’ve taken a first second stab at such a model, borrowing a bit from a recently published trajectory pattern (Hu, et al 2013); input is invited and essential.

journey-way-concepts_construction

Data Format

The GeoJSON data format is in common use and provides a good starting point for a standardized representation of trajectories and paths. Granting that much data is initially gathered in spreadsheets, by and large if it is to be mapped or analyzed spatially, it makes its way into human-readable GeoJSON or the binary shapefile. GeoJSON represents geographic Features in a FeatureCollection, and spatial attributes are represented in a required Geometry object, but time is not accounted for natively. Although temporal attributes of a Feature can be recorded as one or more of a Feature’s Properties there is no norm or best practice for this and mapping software that consumes GeoJSON does not typically look for or make use of temporal attributes.

This can potentially be remedied by an extension to GeoJSON, such as the Topotime format I’ve been developing. Topotime data is valid GeoJSON, but it includes a new, optional When object, and leverages the sparingly used GeometryCollection object that is found in the GeoJSON specification.

One of my tasks at hand—which I welcome collaborative input on—is testing the efficacy of the Topotime model for the several types of historical geospatial network data found in the wild. I’ve begun posting some sample data to the Orbis Initiative GitHub repo.

The Basics of Topotime

Topotime was initially conceived as a means for representing historical temporal data that is vague and otherwise uncertain, for visualization in browser timeline software and for the analysis of probabilistic relationships between and amongst events and periods.

The goals of the Topotime project have recently both broadened and simplified considerably—it is now aimed at extending the GeoJSON format to account for time (including some of the difficult historical cases), without breaking GeoJSON. That is, Topotime data would be recognized as GeoJSON by any software that supports GeoJSON. The work-in-progress described on the Topotime repo is now a little behind samples I’m pushing to the Orbis Initiative repo (kgeographer/oi).

I am working through varied and more complex data examples. When a suitable data format is settled, I’ll write some basic software that accesses Topotime’s unique attributes to browse and search several exemplar datasets.

The following is a snippet to give a sense of it:

topotime-snippet

Next Steps

This effort does not have institutional support at this time, but if enough people feel it’s worth pursuing, we should seek it. UPDATE: A small group of colleagues and I will be submitting grant proposals soon.

As mentioned above, a small group representing several active research projects focused on Asian maritime and land routes will be meeting soon to assess whether Topotime or something like it is appropriate for a “Pelagios for Networks.” We will make our results public for discussion, through this blog and the Pelagios Linked Past SIG forum. More later…and comments are welcome.

The Orbis Initiative: a Pelagios for Networks?

data-triptych

A small sampling of historical network datasets

I believe there would be widespread interest in a global collaboratively developed system, organized similarly to Pelagios, aimed at creating and linking data records for attested historical trajectories (e.g. itineraries, routes, commercial flows, correspondence) and paths (roads, rivers, canals, sea currents). In this provisional semantics, a trajectory is evidence of some person(s) or thing(s) moving from here to there (then there, etc.), at a known, approximate or estimated time and/or in a particular sequence, as attested in some source. A path is the physical medium for trajectories.

Both paths and trajectories can be represented as two or more places and one or more segments (nodes and edges in network parlance). Place nodes are necessarily “geographically embedded” and typically represented by feature centroids. The geometry of paths between nodes for various types of trajectories may be known, estimated, or in the case of some flow data, of no concern.

Historical gazetteers in the Pelagios ecosystem represent only named places. Most are point-like features (e.g. settlements, sites); increasingly, polygonal features are included as well (e.g. regions, administrative areas). But what of historical movement—trajectories between named places along paths? The simple data models used for the Pelagios interchange format and for most gazetteers do not accommodate trajectories and paths.

Not surprisingly, the first early geographic document geo-parsed in Pelagios’ Recogito tool describes an itinerary: “Itinerarium Burdigalense: the Itinerarium Burdigalense (or Bordeaux Itinerary) […] a travel document that records a Pilgrim route between the cities of Bordeaux and Jerusalem.” Although we know each attested place was part of a traveled route, by virtue of its association with a text having “itinerarium” in its title, those relationships are not recorded formally in gazetteers, and therefore not readily discoverable and analyzable as routes and components of networks.

The Orbis Initiative

In February, 2015 I submitted a proposal to the National Science Foundation for a fairly large grant ($1.6m over 3 years) to develop the Orbis Initiative. Although reviews were quite positive, it was not funded. The project was designed to facilitate the creation, archiving, discovery, linking, and analysis of historical geospatial network data for “everywhere and every when.” The project name was borrowed from an interactive scholarly web application I helped build, originally published by Stanford University Libraries in 2012 and significantly upgraded in 2014, ORBIS: The Stanford Geospatial Network Model of the Roman Empire (hereafter, ORBIS: Rome).

Whereas ORBIS: Rome is an authored model of travel and transport for a particular region and period aimed at answering the research questions of one Classical scholar (Walter Scheidel), the Orbis Initiative is instead a system for creating, storing, and linking geospatial network data spanning potentially all places and periods—a distributed repository along with a set of relatively simple interactive web-based tools to facilitate its use. The design and proposed development of the Orbis Initiative is a response to researchers who have expressed a desire to build ORBIS: Rome-like applications for their own areas and periods of study. Importantly, the intent is not to expand the ORBIS: Rome network transport model, but to provide a generic data infrastructure and tools to facilitate development of other models and modeling approaches.

I remain convinced this would be a worthwhile undertaking and subsequently, two opportunities have emerged to begin some of the work described in the grant proposal, at a much smaller initial scale; I’ll discuss one of them here.

A Community of Interest?

Writing the Orbis Initiative grant entailed recruiting collaborators with varied exemplar datasets being developed for ongoing research. Several of those projects are concerned with processes of cultural diffusion and commercial activity—separately and in concert—in East and Central Asia and between Asia and Europe over extended periods. Their aggregated temporal extent is 7th century BCE to 16th century AD. Researchers in those groups, and now a few others, have indicated an immediate pragmatic interest in exposing and linking their data for common benefit. Meetings to discuss next steps have begun.

Something Like Pelagios

An Orbis Initiative would replicate several aspects of the Pelagios Project, which has gained terrific momentum in developing online resources, methods and software for linking historical gazetteers. I believe Pelagios’ success is due in large part to its “ground-up” nature—the fact it answers some immediate requirements of a distinct community of interest for the Classical Mediterranean. Its spatial and temporal extents and software tool development scope are growing organically, expanding upon smallish proofs-of-concept that people find useful. Tools developed so far facilitate data creation (Recogito) and data discovery (Peripleo). The Pelagios approach offers a stark contrast with some “build it and they will come” data repository projects attempted in recent years.

In the same vein, a pragmatic start to an Orbis Initiative could be seeded by meeting the requirements of the above-mentioned community of interest to link (and in a sense gather) their historical geospatial network data: connections by road, river, canal, and sea route between the places attested in Pelagios-compatible gazetteers.

A Conceptual Model

So, networks of trajectories are different in kind from place locations as commonly understood, and as such require a different, somewhat more elaborate data model. Furthermore, while all spatial data may include temporal attributes, some network data—itineraries for example—are inherently temporal; in fact they are events. Flows are essentially aggregated movement events.

In my experience a helpful first step in data modeling is to create a conceptual model of the entities and relations of what is being represented—an ontology design pattern if you will. Typically a collaborative undertaking, the resulting visualization provides a basis for the data schemas to follow, be they relational or graph. I’ve taken a first stab at such a model, using a recently published trajectory pattern (Hu, et al 2013) as a point of departure; input is invited and essential.

path-trajectory-concepts_v2

Data Format

The GeoJSON data format is in common use and provides a good starting point for a standardized representation of trajectories and paths. Granting that much data is initially gathered in spreadsheets, by and large if it is to be mapped or analyzed spatially, it makes its way into human-readable GeoJSON or the binary shapefile. GeoJSON represents geographic Features in a FeatureCollection, and spatial attributes are represented in a required Geometry object, but time is not accounted for natively. Although temporal attributes of a Feature can be recorded as one or more of a Feature’s Properties there is no norm or best practice for this and mapping software that consumes GeoJSON does not typically look for or make use of temporal attributes.

This can potentially be remedied by an extension to GeoJSON, such as the Topotime format I’ve been developing. Topotime data is valid GeoJSON, but it includes a new, optional When object, and leverages the sparingly used GeometryCollection object that is found in the GeoJSON specification.

One of my tasks at hand—which I welcome collaborative input on—is testing the efficacy of the Topotime model for the several types of historical geospatial network data found in the wild.

The Basics of Topotime

Topotime was initially conceived as a means for representing historical temporal data that is vague and otherwise uncertain, for visualization in browser timeline software and for the analysis of probabilistic relationships between and amongst events and periods.

The goals of the Topotime project have recently both broadened and simplified considerably—now essentially aimed at extending the GeoJSON format to account for time (including some of the difficult historical cases), without breaking GeoJSON. That is, Topotime data would be recognized as GeoJSON by any software that supports GeoJSON.

Work-in-progress is described, with a few toy examples, at https://github.com/kgeographer/topotime. I’m planning to work through varied and more complex data examples soon, then write some basic software that accesses Topotime’s unique attributes.

The following is a snippet to give a sense of it:

topotime_smal-example

Next Steps

This effort does not have institutional support at this time, but if enough people feel it’s worth pursuing, we should seek it.

As mentioned earlier, a small group representing several active research projects focused on Asian maritime and land routes will be meeting soon to assess whether Topotime or something like it is appropriate for a “Pelagios for Networks.” We will make our results public for discussion, possibly through the Pelagios SIG infrastructure. More later… and comments are welcome.

Topotime and Place

two-up_blogI’ve recently been co-developing with colleague Elijah Meeks something called Topotime, which at this stage is experimental software for rendering timelines and doing some computational reasoning about historical timespans, such as calculating overlap. The first adjective we use to describe this work is pragmatic, because we felt we had thought hard enough about time versus temporality for digital humanities work [1], and built enough temporal data models and timelines, that we should begin some concrete steps to “operationalize” [2] our views and personal wishlists in some working software. The results to date have just been publicly released on GitHub, and we hope other will participate in its further development. Elements of the Topotime data model and software are novel (we think) but it is built around a couple of common and successful design patterns.

First, Topotime models Periods in PeriodCollections, much as GeoJSON models Features in FeatureCollections. GeoJSON Features have a typed geometry and unlimited number of user-defined properties. Topotime Periods have typed timespans (tSpan) and unlimited user-defined properties. Topotime can be written as a JSON object, just as GeoJSON is. I find the symmetry between representation requirements for spatial things and temporal things astonishing, although it would probably not surprise physicists. For starters, both have names, metrical representations (geometries, even), and are usefully typed. The close relationship between places and periods will be a refrain on this blog.

features_periods-compare

The second borrowed pattern is representing the uncertain boundaries of intervals as intervals themselves, not “instants” (there aren’t very many instants in historiography). The result is a quad of start (s), latest start (ls), earliest end (ee), and end (e). The first and third of these can be stated in natural language as “not before,” and the second and fourth as “not after.” This pattern appears in Simile Timeline and in several scholarly works I cited in an earlier blog post.

temporal-geometry_fig4

Topotime extends that pattern to allow any of these to be qualified as “about” or “approximately” (~) some day, month or year. It also parses an elaboration of the starting and ending spans (sls and eee respectively). The result is a function returning a probability y for any time x. The area under the function’s curve, although not a useful number in and of itself, can be used to good effect in computing overlap with other period or event timespans, and with query areas (as discussed in this short paper [PDF], and earlier demonstrated by Kauppinen et al [3]). The Topotime model also permits specifying intermittent, multi-part timespans which can be cyclical or irregular.

Meeting of minds (and conceptualizations)

Topotime’s name, courtesy of Elijah, stems from our wish to capture certain topological relations between periods (their timespans actually). We can know a period or event began after another and not know when that is exactly but wish to represent and reason about that adjacency. Similarly, we may know two events (lives, e.g.) overlapped, but have only minimal information about their starts and ends.

As it turned out, tackling that issue led to a more involved data model. Its hard to know where to put the bounds on development projects, due to the EAGER principle we live by here: Everything’s A Graph and Everything’s Related. Both Elijah and I have been working at event data models for multiple projects for several years, and this was an opportunity to operationalize some of our individual perspectives, which differ but seem to have important overlaps as well.

These are a couple of the agreements and how they’ve appeared in Topotime so far:

  • There are temporal things, which include events, historical periods, and lifespans of things, people and groups (e.g. nations). They all share some representation requirements, so in software we can make a super-class for them, potentially specializing distinctive differences in sub-classes later. But for the time being every temporal thing is a Period, for lack of a better all-encompassing term, and we don’t do anything different for events, lifespans and historical periods. If you add an attribute like class or css_class to the generic periods you can make them render distinctively in a timeline app.
  • Periods have meaningful relationships to other Periods, some of which are non-topological. For this, Topotime recognizes a relations[ ] array of simple subject-predicate-object triples. This will be written as JSON-LD soon, and therefore be Semantic Web compatible. That is, although relationships between the timespans of two events are metrical, measured, and possibly incidental (they overlap, abut, are disjoint, etc.), relationships between periods are a different thing. The most basic is compositional, or mereological ( Peter Simons’ Parts: A study in ontology is fascinating, and short). Events are composed of or contained by other events. We use a part_of relation for this.

Other relationships researchers might wish to encode include caused, required, led_to, etc., none of which we deal with yet. At minimum we might like to visualize our understandings and arguments about these in timeline interfaces (perhaps along the lines of Nowiskie and Drucker’s PlaySpace 2003 [1]). Quite possibly, we can find further interesting ways to compute over them, but they first must find their way into data models.

[1] Although not as hard as Bethany Nowiskie and Johanna Drucker! I only recently came across a trove of their interesting work theorizing time v. temporality, and building out pilots for novel timeline applications for digital humanities. For example, the Temporal Modelling Project and PlaySpace 2003 [screenshots]

[2] A term with plenty of history, but recently the subject of a really nice Stanford Lit Lab pamphlet by Franco Moretti.

[3] Tomi Kauppinen, Glauco Mantegari, Panu Paakkarinen, Heini Kuittinen, Eero Hyvönen, and Stefania Bandini. (2010). Determining Relevance of Imprecise Temporal Intervals for Cultural Heritage Information Retrieval. International Journal of Human-Computer Studies, Volume 68, Issue 9, pp. 549-560 , Elsevier. Preprint PDF

Topotime: Qualitative reasoning for historical time

semi-intervals_1
Fig. 1 – Christian Freksa’s (1992) semi-intervals – Allen’s interval relations as components of temporal conceptual neighborhoods, discussed below

When my colleague Elijah Meeks recently tweeted about the possibility of a temporal topology data standard (“topotime” as he called it), my reaction was: Fantastic! Maybe the time has arrived, so to speak, for a proper Period datatype in relational databases like PostgreSQL, to meet the needs of historical scholarship—a comprehensive means for qualitative reasoning about historical time. And while we’re at it, how about a generic Period ontology design pattern that could be used in any RDFS/OWL representations?  It’s not that a start towards topotime hasn’t been made, only that we can advance things considerably if we as a community get specific about general requirements. Hmm…specifics about generality.

Our standard options in relational databases at the moment are to use one or more ISO 8601 date fields or integer fields to cobble together something that meets our immediate requirements: for example, either a single DATE or YEAR, or START and END fields in a form of either yyyy‑mm‑dd, or nnnn. We can then use the operators <, >, and = to readily compute the 13 relations of Allen’s interval algebra (before, meets, overlaps, starts, during, finishes-and their inverses-plus equals). In RDF-world, we find the Allen relations are present in CIDOC-CRM.

What more could we (humanist representers of time and temporality) possibly want? That question was the topic of a short talk I gave in a recent panel at the DH2013 in Lincoln, NE. How about a single Period field for starters—a compound date?

In fact, an existing extension for PostgreSQL written by Jeff Davis provides this (https://github.com/jeff-davis/PostgreSQL-Temporal), and I’ve used it several times. Davis provides, along with operators for standard Allen relations, several more to get finer grain, e.g. to differentiate between before (overlaps-or-left-of) and strictly-before. There are also numerous functions for computing relationships in SQL statements. A Period is entered as a date array that looks like this:

[ (yyyy-mm-dd), (yyyy-mm-dd) ]

The begin and end dates (and parts thereof) are still accessible using first(period) and last(period) functions, and these can be used in concert with PostgreSQL’s built-in date-part and interval functions to calculate periods of interest on the fly. For example, in a recent project we converted birth and death dates to Period lifetimes and calculated contemporaries as individuals who were adults ( >= 17 ) at the same time: overlaps( (first(lifetime)::date + 17 years, last(lifetime)), (1832-01-01, 1874-11-23)).

semi-intervals_2
Fig. 2 – The “survived-by” conceptual neighborhood merges several semi-interval relations

If you happen to be using PostgreSQL, this helps with many use cases, but we can and should go much further. I made a baby step in the course of dissertation research, by writing a series of Postgres functions to perform some minimal computation over Christian Freksa’s temporal conceptual neighborhoods (sets of 13 semi‑intervals) using the Period datatype (Fig. 2). These neighborhoods are sets of semi-interval relations corresponding to some common (and not so common) reasoning tasks. For example, survived-by merges less‑than, meets, overlaps(left), starts, and during. Freksa’s algebra has many more elements which I didn’t use, but should be considered going forward.

Now, what of uncertainty in its many forms—the vague, probabilistic, and contested data we routinely encounter? The many classes of uncertainty have been outlined in a fairly exhaustive taxonomy a decade ago by historical geographer Brandon Plewe (2002), and that work should be helpful in future modeling efforts. If an event began “most likely in late Spring, 1832 (Jones 2013),” when should its representation appear in a dynamic interactive visualization having a granularity of months? When it appears in a time-filtering application, how should it differ from an event that began in “April, 1832 (Smith 2012)?”

Application logic to do something about such cases would need an underlying temporal entity having a probability (0 – 1) and/or some kind of ‘confidence’ weight. If we’re talking about the span of the event, it’s a period bounded not by instants (dates) but by periods, each with an author and probability/confidence value.

In fact, some very nice research to formalize such temporal objects using periods bounded by periods has been done in the context of historical/heritage applications. Members of the FinnOnto group (Kaupinnen et al 2010) have developed a formal representation and algebra for fuzzy historical intervals (Fig. 3).

kaupinnen_1
Figure 3 – The period ‘‘from around the beginning of the 1st century B.C. to the first half of the 1st century A.D.’’ represented as a fuzzy temporal interval. The fuzzy bounds for start and end are 10- and 14-year periods respectively.
holmen_1
Fig. 4 – Deduction rule for A1 < A2, where A1, A2 are two points in time modeled as intervals.

In the realm of semantic (ontological) representations, Holmen and Ore (2009) have developed a database system based on the event-centric CIDOC-CRM that includes an algebra (Fig. 4) and temporal analyzer module to reduce fuzziness and aid in the creation of event sequences as “Stored Story Objects.” Like the previous work, period starts and ends are represented as intervals.

Ceri Binding (2009) developed a CIDOC-CRM based representation of multiple attestations of historical periods and their extents for the archaeological project, STARS.

All of the work I’ve mentioned seems to me compatible in fundamental respects. I believe that as a community of interest can we can collaboratively develop a few shared resources that would be very helpful for many research projects. For example, a Linked Data repository of historical periods along the lines of what Pleiades/Pelagios does for places in the Classical Mediterranean. Lex Berman of the Harvard Center for Geographical Analysis has given this a lot of thought and done some prototype work, as have others. What is the right venue for making this happen?

Another concrete goal is extending the Period datatype for PostgreSQL to allow a probability or confidence term for each bounding period. Once that is worked out, someone might even port it to ArcGIS. Yeah.

NOTE: These and related topics are among those to be addressed by a proposed new GeoHumanities SIG for the Alliance of Digital Humanities Organizations (ADHO) I’m co-instigating with Kathy Weimer of Texas A & M. Further word on that within a week or so.

Cited works

Binding, C. (2009). Implementing archaeological time periods using CIDOC CRM and SKOS. CAA 2009 Proceedings (http://hypermedia.research.southwales.ac.uk/media/files/documents/2010-06-09/ESWC2010_binding_paper.pdf)

Freksa, C. (1992). Temporal reasoning based on semi-intervals, Artificial Intelligence 54, 199-227
(http://cindy.informatik.uni-bremen.de/cosy/staff/freksa/publications/TemReBaSeIn92.pdf)

Kauppinen, T., Mantegari, G., Paakkarinen, P., Kuittinen,  H., Hyvonen, E., Bandini, S. (2010). Determining relevance of imprecise temporal intervals for cultural heritage information retrieval. International Journal of Human-Computer Studies 68 (2010) 549–560 (http://kauppinen.net/tomi/temporal-relevance-ijhcs2010.pdf)

Holmen, J., and Ore, C. (2009). Deducing event chronology in a cultural heritage documentation system. In CAA 2009 Proceedings (http://www.edd.uio.no/artiklar/arkeologi/holmen_ore_caa2009.pdf)

Plewe, B. (2002). The Nature of Uncertainty in Historical Geographic Information. Transactions in GIS, 6(4): 431-456. (http://dusk.geo.orst.edu/buffgis/TGIS_uncertainty.pdf)

Plewe, B. (2003). Representing Datum-level Uncertainty in Historical GIS. Cartography and Geographic Information Science, 30(4):319-334