GeoJSON-T is a proposed extension to the GeoJSON data standard (spec) widely used “for encoding a variety of geographic data structures,” principally in web maps. GeoJSON-T is described in the README file of its GitHub repository, but there is not yet a versioned specification. Now would be a good time to make refinements and write one. To join that discussion, see Issue #3 in the GeoJSON-T GitHub repository.
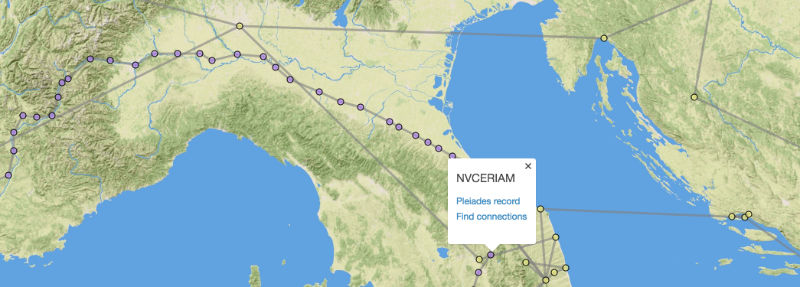
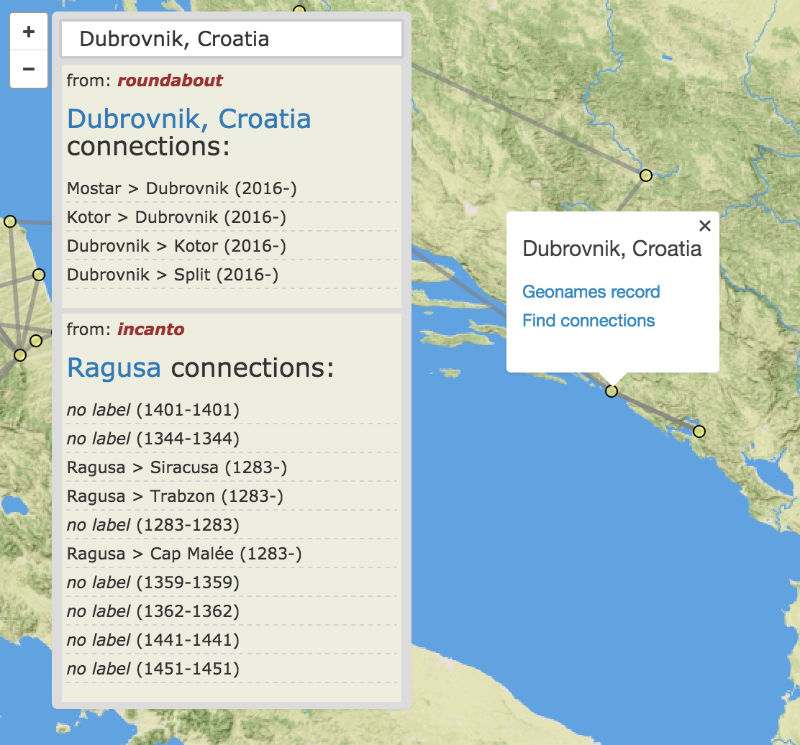
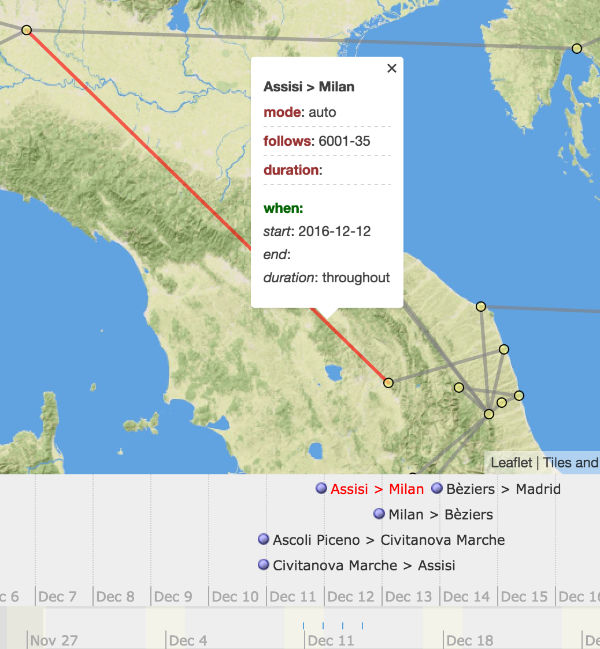
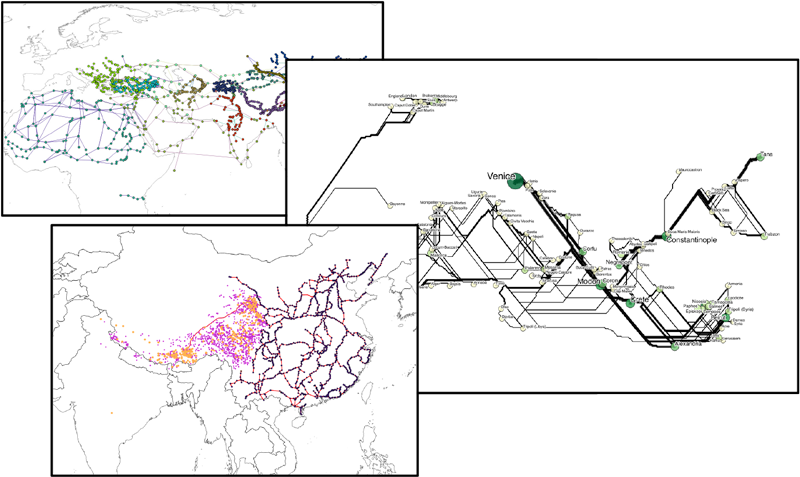
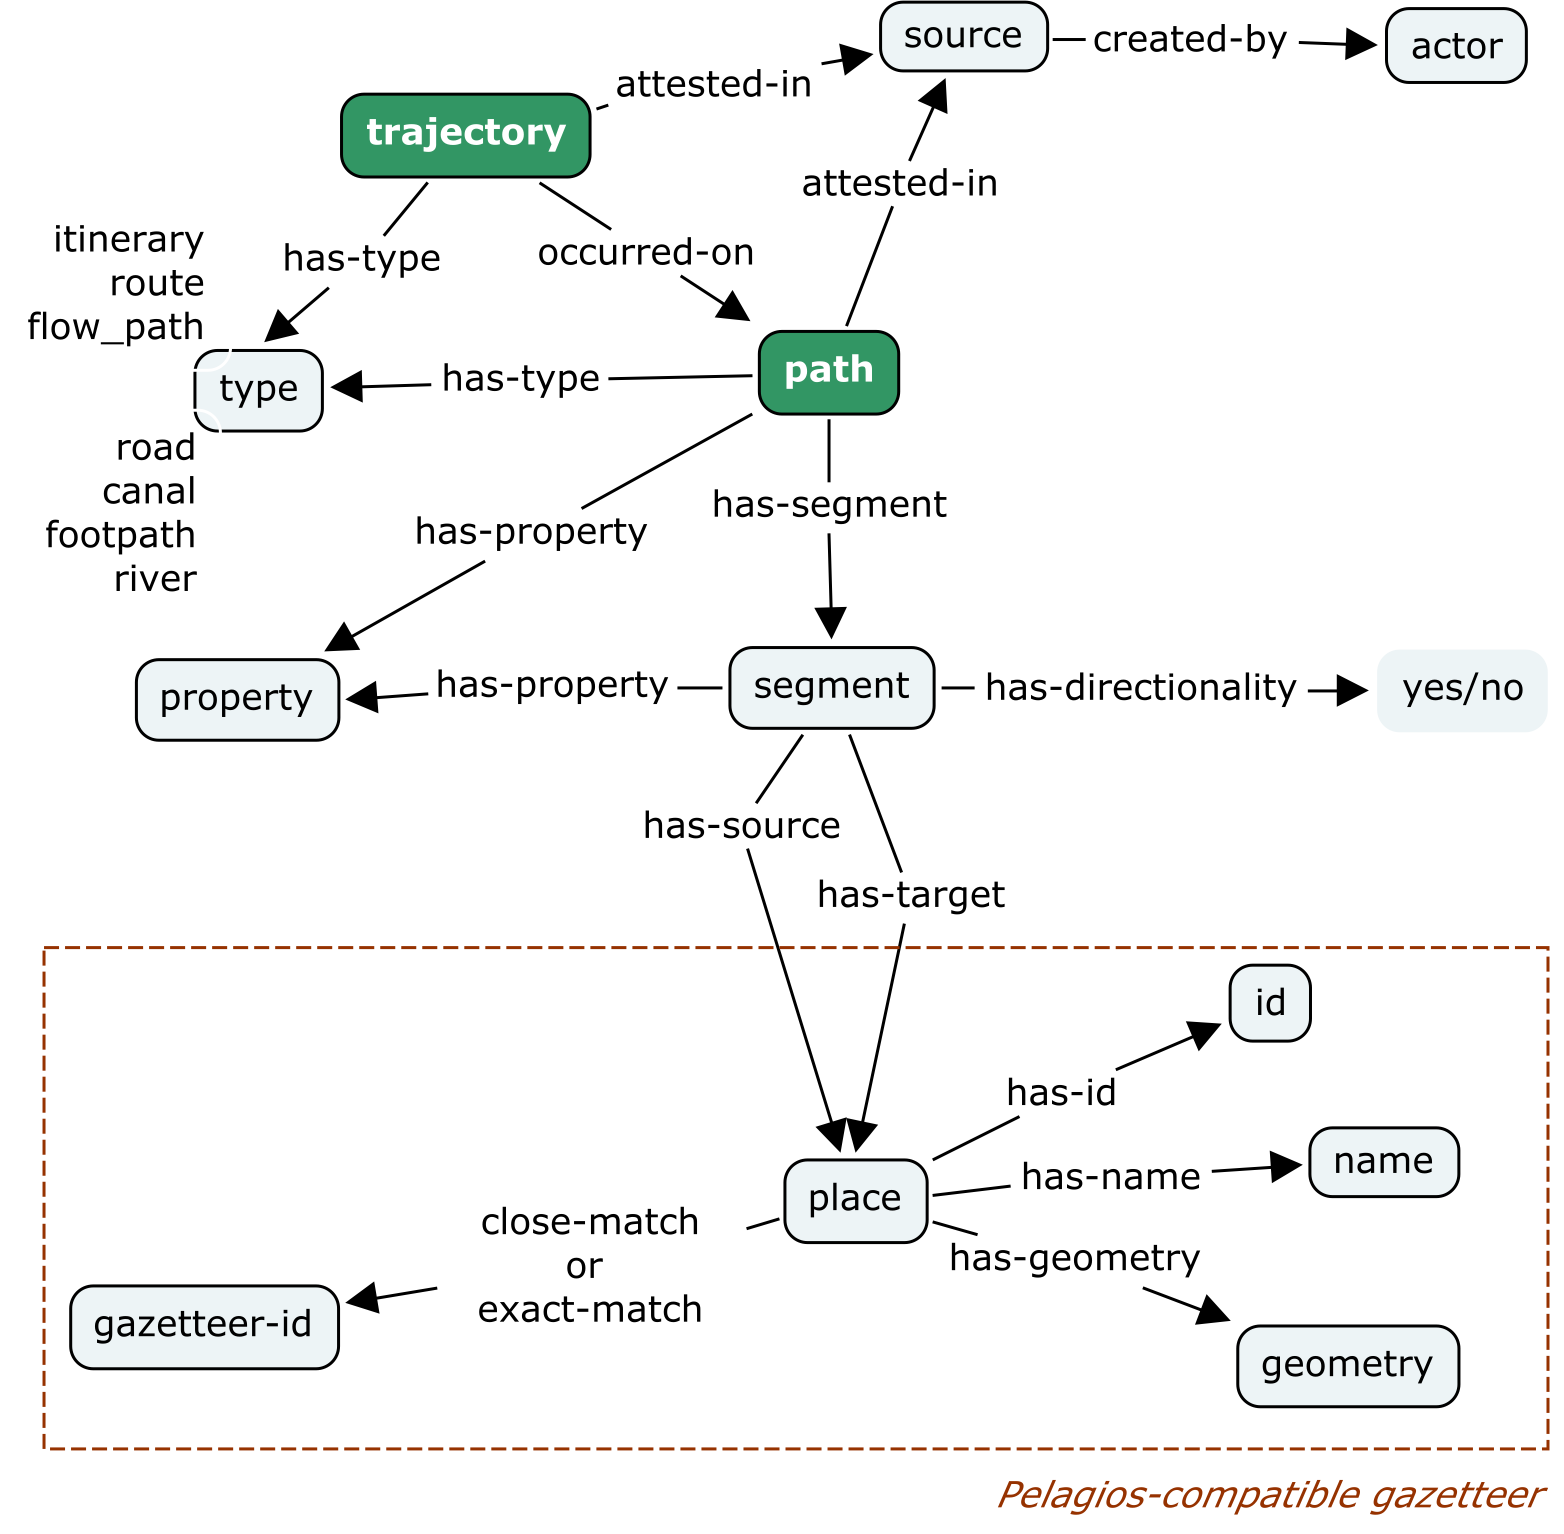
GeoJSON-T was initially developed in 2017 [1], motivated particularly by requirements of historical researchers. Many geographic features of interest have a temporal scope, and a standard way of describing geographic and temporal extents together would benefit creators of web applications meant to view and analyze such data [2]. A pilot map+time application, now called Linked Paths, was developed at that time to test and demonstrate its implementation.
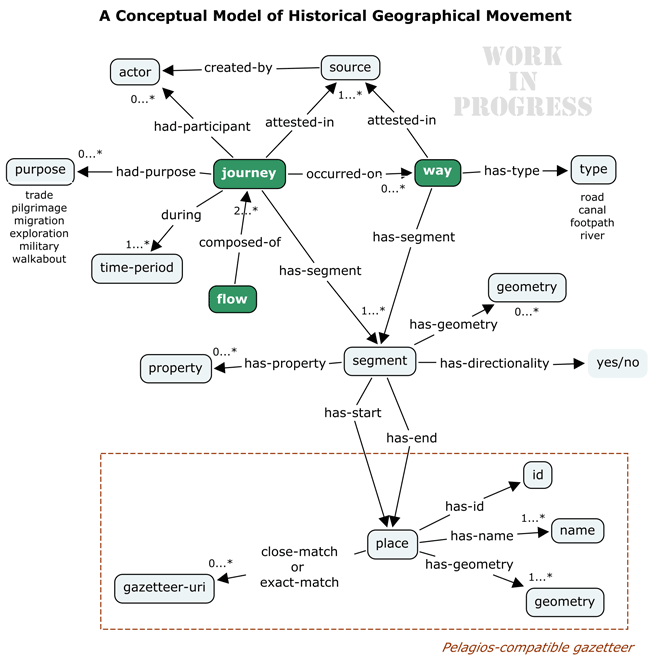
The temporal attributes of “typical” geographic features such as countries, regions, provinces, cities, buildings, and monuments are important for understanding change over time. But we also routinely map and analyze spatial patterns in many other kinds of historical phenomena: events, and “event-like” features including conflict, births and deaths, finds of archaeological objects, as well as many kinds of geographic movement, including journeys and flows.
Just use “properties”?
The temporal attributes of a GeoJSON Feature can be represented as among its “properties,” and web map applications are routinely built to parse temporal data there and use it to display dynamical change. For example:
{ "type": "Feature",
  "geometry": {"type":"Point", "coordinates": [0.0,0.0]},
  "properties": {
    "name": "Null Island",
    "start": "1492",
    "end": "1500",
    "prop1": "some value", ...
  }
}
But there are several shortcomings inherent in this approach, including:
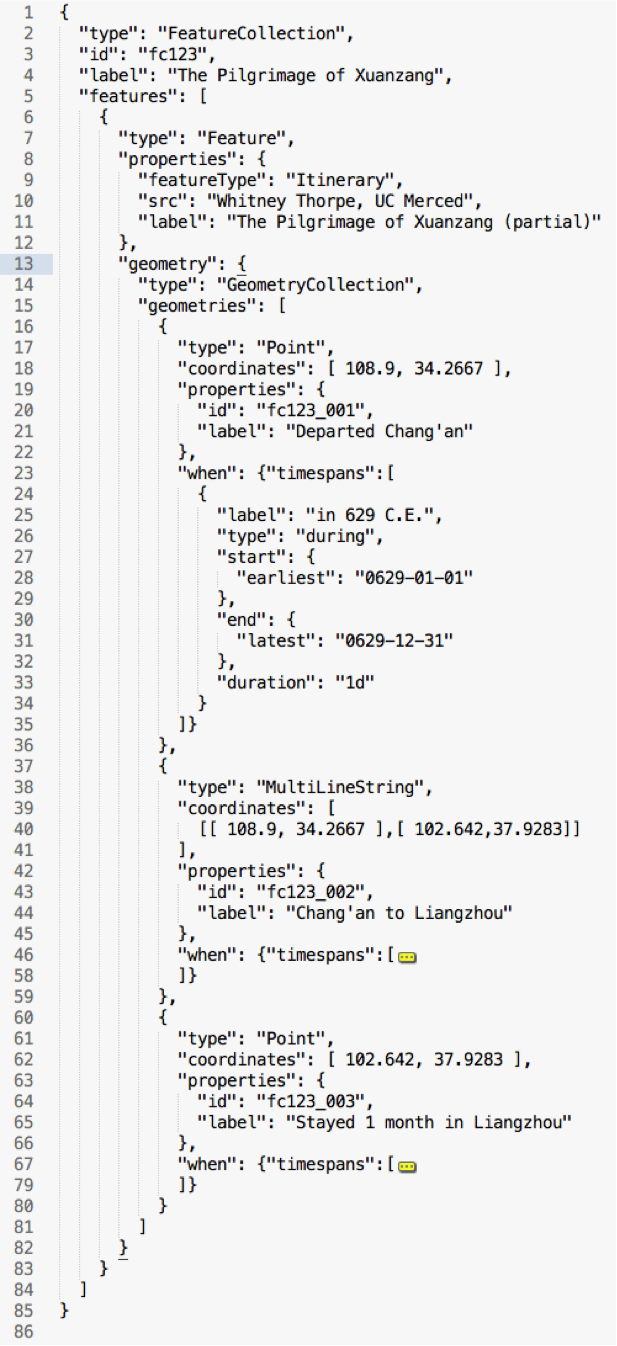
1) A given feature might change location or shape over time; this can currently only be handled by creating multiple Features for the same thing/place, each with different time properties. Better to put all of a place’s geometries in a GeometryCollection and let each have its own “when.”
2) Likewise, other properties of a feature might change over time, for example name and type (e.g. villa to town to city). These too can be temporally scoped with their own “when.”
3) The labels used for temporal property keys (‘start’ vs. ‘begin’ vs. ‘year’ etc.) vary per dataset, so data from one project can’t be linked to or combined with data from another unless there is prior coordination. Without a standard vocabulary and structure, there can’t be a generic, open-source “time map” library for rendering maps with various temporal visualizations [2].
4) There are no conventions for expressing the various types of uncertainty found in historical data, including vagueness, imprecision, unknown values.
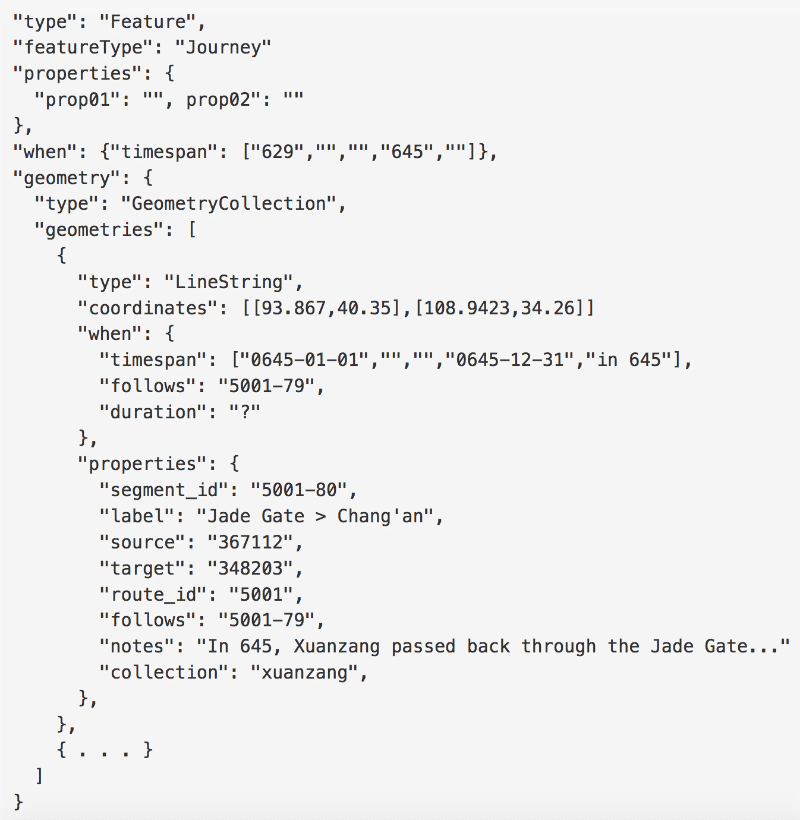
5) Movement features such as journeys, lifepaths, and flows can contain multiple nodes and edges, each with distinctive associated timestamps or intervals. In cases, sequence is known but dates are not.
Just add “when”
What GeoJSON-T does is specify vocabulary and structure for a “when” object, which can be added in several locations outside of the “properties” element required by GeoJSON (foreign member in the vocabulary of the GeoJSON spec):
1) At the level of a Feature, applying to all geometries within it (simple example here; for all options see the draft specification):
{ "type": "Feature",
  "geometry": {"type":"Point", "coordinates": [0.0,0.0]},
  "properties": { "name": "Null Island", "prop1": "some value", ... },
  "when" {
    "timespans":[{"start": "1492", "end": "1500", }]
  }
 }
2) At the level of an individual geometry within a GeometryCollection, e.g.
{ "type": "Feature",
  "geometry": {
    "type":"GeometryCollection",
    "geometries": [
      {"type":"Point",
       "coordinates": [0.0,0.0],
       "when": {"timespans":[{"start": "1492", "end": "1495", }]}
      },
      {"type":"Point",
       "coordinates": [1.0,2.0],
       "when": {"timespans":[{"start": "1498", "end": "1500", }]}
      }]
    },
    "properties": { "name": "Null Island", "prop1": "some value" }
}
3) At the level of a FeatureCollection, applying to all of its Features
A “when” object can include optionally one or more timespans, and/or one or more named periods from a time period gazetteer. These and other optional properties are described in the repo README. Some proposed changes are listed in Issue #3 in the repo, which is open for comment.
Existing GeoJSON-compatible apps and libraries will simply ignore “when” objects, wherever they might be. Support for “when” would be included in any new software and libraries supporting the GeoJSON-T extension.
Current and planned adoption
In recent months, GeoJSON-T has received increasing attention, a couple of test implementations, and plans for more. These have highlighted some issues, and the draft format needs a closer examination for it to become a versioned specification of a standard format.
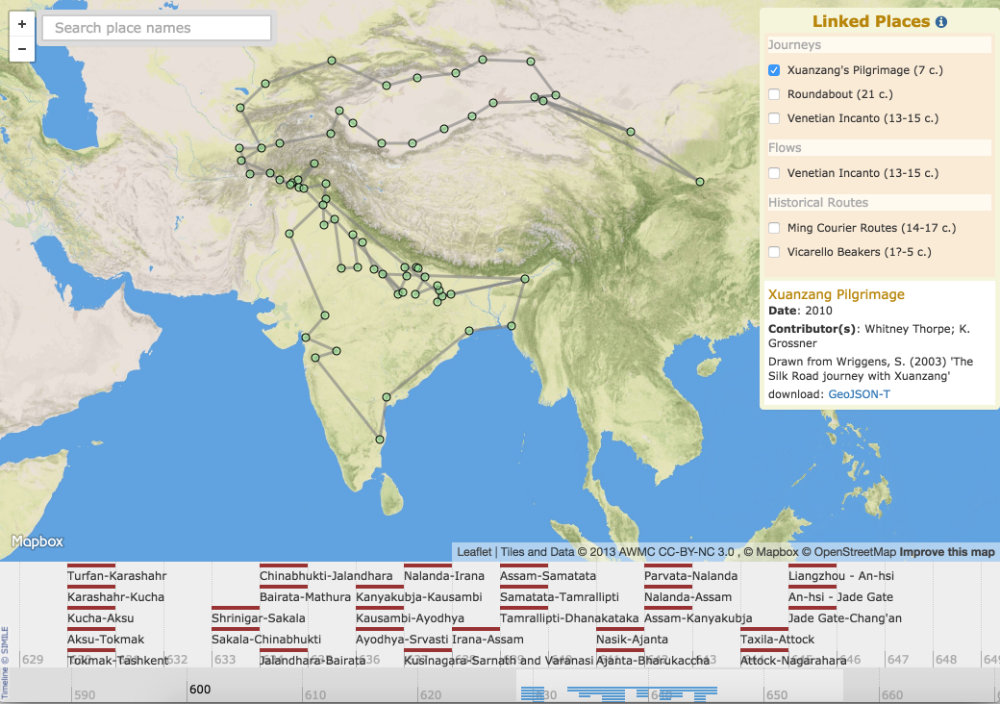
Linked Places format
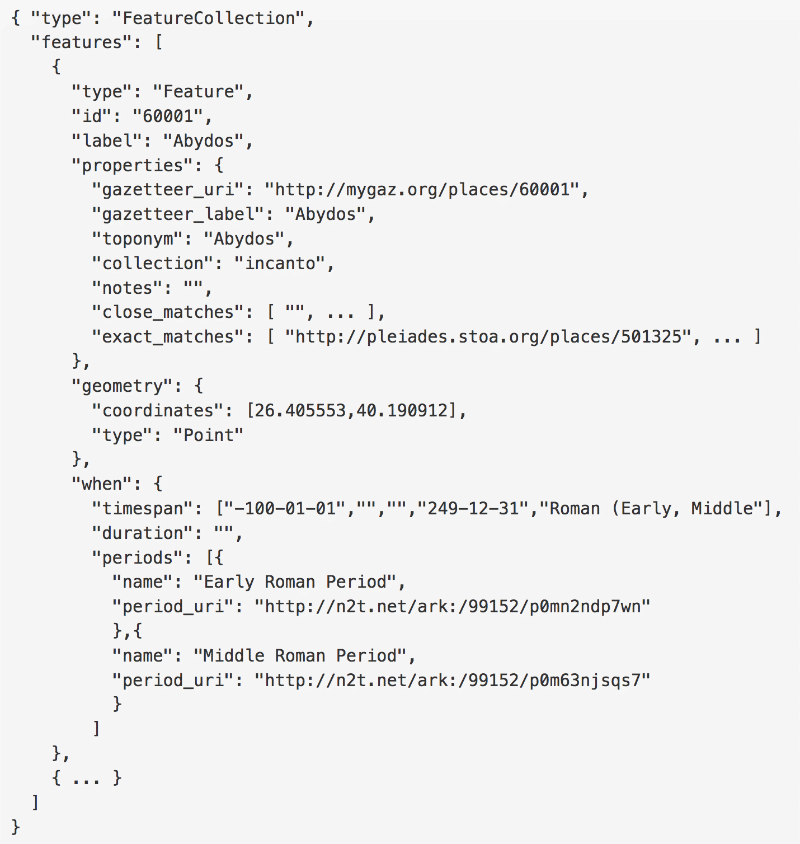
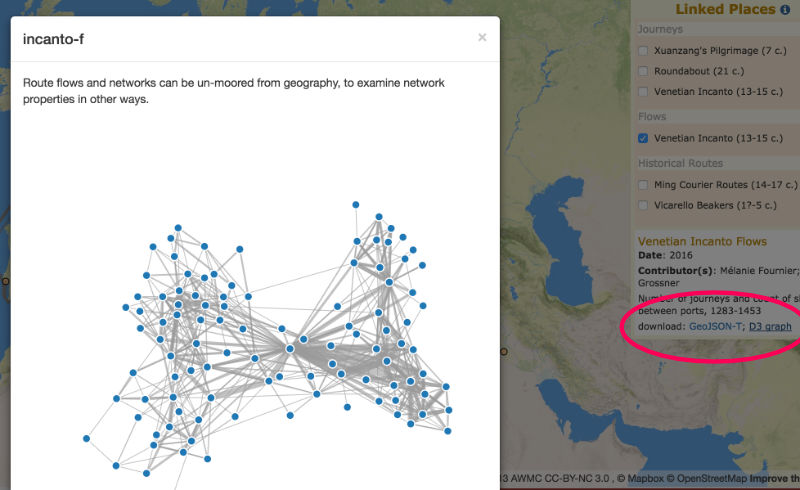
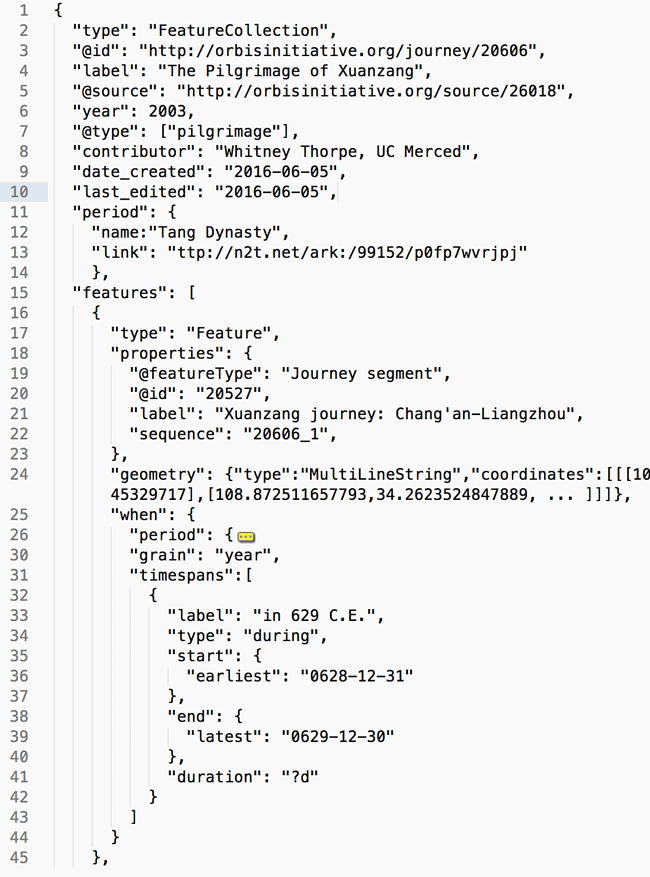
The GeoJSON-T patterns for time were adopted for Linked Places format (LPF), developed in 2018 for contributions to the World Historical Gazetteer and Pelagios project’s Recogito platforms. LPF is not only valid GeoJSON, but valid JSON-LD, a syntax of RDF, and it standardizes the representation of several additional dimensions of Place beyond geometry and when: names, types, relations, descriptions, depictions, depictions, and links to corresponding external place records.
Linked Places format is therefore a specialized superset of GeoJSON-T, intended for historical gazetteer platforms specifically.
WebMaps-T
This early-stage project led by the British Library [3] seeks to develop a standard, customizable library for map+time visualizations in web applications, and would render data formatted as GeoJSON-T.
IIIF Maps Community Group
The International Image Interoperability Framework (IIIF) now has a working group dedicated to “defining best practice in associating geographical information with IIIF materials.” The Maps group is “explor(ing) creating a JSON schema [meeting] the needs of the IIIF community” specifically for map images, and is at least informally evaluating GeoJSON-T toward that end.
Notes
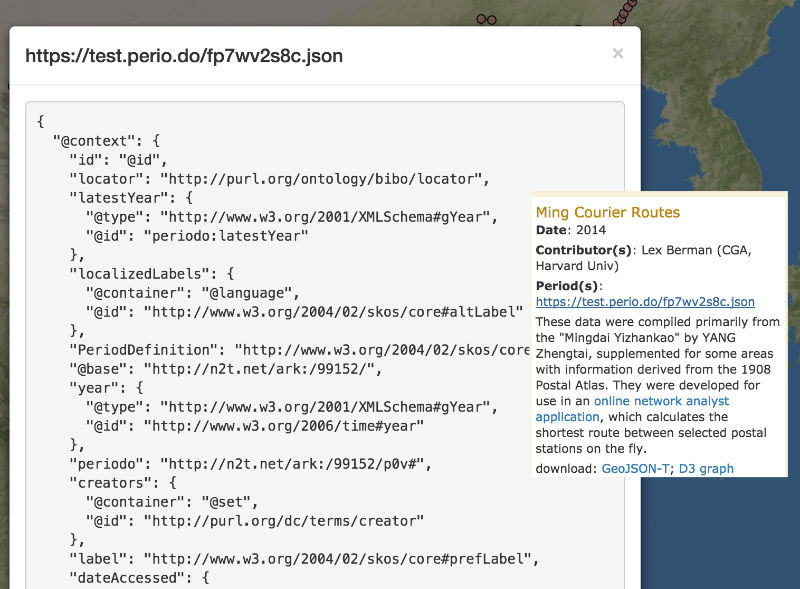
[1] In 2016, supported by a small Resource Development Grant from the Pelagios project, I met with colleagues Lex Berman and Rainer Simon to outline a GeoJSON format extension that could handle features representing historical geographic movement. GeoJSON-T and the Linked Paths pilot were products of that work. That project, titled “Linking Linked Places,” is documented in this blog post.
[2] The Timemap.js library developed by Nick Rabinowitz in 2008 joined the SIMILE Timeline library with several web mapping libraries of that era. It has fallen into disuse due to outdated dependency issues.
[3] An initiating hackathon for WebMaps-T took place in London in 2019, hosted at the British Library by Gethin Rees and Adi Keinan-Schoonbaert, with funding from a Pelagios Working Group small grant. Work to refine its early products continues, albeit slowed by lack of further funding. WebMaps-T is intended to have a modular structure permitting several types of temporal visualizations, including multiple timeline styles and histograms.