This March 2026 prospectus describes the initiative as it was originally conceived. For current state, see [this new post] and the latest EDOP Project Summary.
1. Introduction
"One has not fully understood the nature of an area until one has learned to see it as an organic unit, to comprehend land and life in terms of each other."
-- Carl Sauer (1925). Morphology of Landscape.
The Computing Place initiative introduced here was originally motivated by geographer Carl Sauer's canonical paper Morphology of Landscape. In it, he asserted that "...area or landscape is the field of Geography, because it is a naively given important section of reality, not a sophisticated thesis." He introduced to American geographers the term "cultural landscape" as a translation of "Kulturlandschaft," a conceptual framing well-known to German geographers at the time. Its content, he wrote, is found "...in the physical qualities of area that are significant to man and in the forms of his use of the area, in facts of physical background and facts of human culture." But Sauer sought to constrain the discipline to one direction of analysis: "...we are not concerned in geography with the energy, customs, or beliefs of man but with man's record upon the landscape."
![]() I wondered what Sauer might have done if some of the now common technological tools and methods had been available to him, and I thought that given sufficient "facts of physical background and facts of human culture," both directions of analysis are possible and warranted. Sauer did allow that the relations between environment and culture are bi-directional, but left the cultural elements to anthropology. Generously, but I think short-sightedly.
I wondered what Sauer might have done if some of the now common technological tools and methods had been available to him, and I thought that given sufficient "facts of physical background and facts of human culture," both directions of analysis are possible and warranted. Sauer did allow that the relations between environment and culture are bi-directional, but left the cultural elements to anthropology. Generously, but I think short-sightedly.
Historians, archaeologists, and anthropologists invoke environmental context constantly, but almost always qualitatively. What would it mean to make those invocations in some degree computable and reproducible? Computing Place envisions digital infrastructure--data and software tools--that supports both directions of inquiry.
Cultural analysis with a geographic lens in this context requires a solid environmental data foundation. Computing Place development is organized around two components, Environmental Dimensions of Place (EDOP) and Cultural Dimensions of Place (CDOP). EDOP is naturally the first priority because the environmental foundation must precede the cultural analysis. Most of what follows describes work in progress towards an EDOP "signature," computable for any given terrestrial location. The overall project is designed to surface patterns and expose what can and cannot be characterized computationally, without presupposing results.
2. What "computing place" means, and what it doesn't
The subject matter of Computing Place is indeed well-trodden intellectual terrain. Scholars in history, anthropology, archaeology, environmental history, historical ecology, and geography have long studied the relations between environment and culture. Computing Place aims at novel methodology--to make many of those relations formally computable and develop tools and features for an accessible and open web platform. EDOP signatures are reproducible environmental characterizations that can be compared systematically across thousands of locations and time periods, linked to cultural datasets from the CDOP component, and tested against independent evidence.
While there are clear relations between cultural phenomena of all kinds and their environmental settings, the Computing Place project deliberately steers clear of environmental determinism. An underlying premise is that while environment generally defines what activities a geographic area affords and constrains, culture determines which possibilities are realized.
3. The environmental signature concept
3.1 Signature components
For any terrestrial location, the EDOP service delivers a set of values for selected environmental attributes drawn from one or more global datasets. At present the principal source is the global BasinATLAS dataset, which compiles a wide range of hydro-environmental attributes from existing global datasets in a consistent, globally applicable format. BasinATLAS is organized hierarchically in 12 "levels" of increasing granularity (decreasing area). Initially, 47 of the 281 BasinATLAS attributes, were drawn from all six of its categories (hydrology, physiography, climate, landcover, soils & geology, anthropogenic) at Level 08 (~190k basins). For EDOP purposes, the attributes have been grouped into four "persistence bands," intended to reflect potential temporal validity. Signature requests can include the values of any combination of bands:
-
A - Physiographic bedrock (millennia) [elevation, slope, stream gradient, lithology, karst extent]. Indicative of the energy cost of movement, defensive advantages of terrain, and raw materials available for construction and agriculture, stable over millennia.
-
B - Hydro-climatic baselines (centuries) [discharge, basin area, groundwater depth, natural vegetation potential, soil texture]. The potential of a landscape; while specific values fluctuate over time, the relative hierarchy (e.g., "Basin A is always wetter than Basin B") is usually stable across historical eras.
-
C - Bioclimatic proxies (decadal/cyclical) [precipitation, temperature, aridity, wetland extent, permafrost, ecoregion membership]. Potentially useful as a baseline "modern average" of values. Interpretation typically requires accounting for known historical anomalies.
-
D - Anthropocene markers (last 50-100 years) [reservoir volume, land cover, cropland/pasture, pop density, human footprint, GDP/HDI]. Typically omitted from signature requests for most historical contexts.
What distinguishes an EDOP signature from a simple attribute lookup is a process orientation: the aim is to characterize not merely what surrounds a location but what it experiences through directed spatial processes. In the hydrological case, upstream values indicate what a river system delivers to a location, often seasonally. For example, a signature query for ancient Ur returns 94mm/yr local precipitation and an aridity index of 5--certainly hyper-arid. But the catchment feeding it receives 258mm/yr. That gap between local and upstream is a more complete environmental characterization. Alluvial civilizations are places where those two values diverge sharply.
Going forward, spatial data and descriptive text from ecoregion datasets will be incorporated as options in user-configured EDOP service API payloads.
3.2 Signature extents
The EDOP service (EDOPS hereafter) will provide signatures for any terrestrial location, given as geographic coordinates. An integrated component facilitates place name resolution using the API of World Historical Gazetteer. If coordinates are of a representative point, for example of a settlement, site, or anthropological observation, the signature returned will be that of a single containing basin--normally less than useful. Environmental context is not intrinsic to a point; it is a modeled neighborhood, therefore EDOPS will treat neighborhood definition as a transparent, swappable parameter, offering multiple ways of defining one on the fly, per-query: for example, (i) single basin at a requested scale level, (ii) immediate siblings, (iii) basins overlapping a user-supplied area or buffer, or (iv) basins within the containing watershed.
When a user supplies a polygon (e.g., a polity boundary, an urban footprint, or a drawn region), the polygon itself defines the neighborhood. EDOPS computes a composite signature by intersecting the polygon with hydrologic basins at a given level, applying area-weighted aggregation of environmental variables, and returning a structured signature. There are several open research questions regarding this step, including (i) which basin level/scale is most appropriate, (ii) how weighting of partial basins is computed, (iii) how the heterogeneity of a resulting set of multiple signatures is represented and computed over, and (iv) how scale sensitivity is evaluated.
4. The EDOPS process orientation, more broadly
As mentioned above, a novel aspect of EDOPS signatures is the aim to summarize formally what a place experiences, not only what surrounds it—"action-at-a-distance" (Goodchild 2026). The hydrological case for Ur mentioned above can be expanded; considering upstream values is only one half of a broader directional frame. Moving forward, other aspects available in the data that could be considered include (i) how far a location sits from its marine outlet, and (ii) whether its linked basins terminate in the sea at all. In many cases, marine resources are an important aspect of environmental affordances a place and its resident cultures may experience.
Beyond the hydrological case, other process types can follow the same logic: terrain slope and gradient as indicators of intrinsic movement cost and accessibility, or atmospheric conditions shaped by prevailing winds. Social connectivity structured by route networks is a longer-term possibility. Each process type will have its own geometry and its own characteristic distance decay.
Spatial data and descriptive text from OneEarth ecoregion datasets--including Wikipedia-derived summaries for all 847 ecoregions--are already incorporated into the EDOP prototype and will be available as optional parameters in the EDOPS API.
5. The EDOP data infrastructure
The BasinATLAS and OneEarth ecoregions data are both available under open CC-BY licenses, as are Wikipedia ecoregion articles. The current EDOP prototype utilizes BasinATLAS Level 08 data, which partitions the terrestrial Earth surface into 190,675 nested drainage units (catchments). BasinATLAS defines a 12-level hierarchy (Levels 01--12), spanning scales from continental basins to fine-grained local catchments.
A well-known characteristic of spatial data is the Modifiable Areal Unit Problem (MAUP), where "the results of mapping or statistical analysis may differ when using different spatial units of aggregation." (cf. UCGIS Body Of Knowledge). A signature computed for the watershed containing Rome looks different from one computed for the small sub-basin immediately beneath a single representative point given for the Capitoline Hill. A systematic scale sensitivity analysis across multiple BasinATLAS levels is the next planned analytical contribution, and will inform which level is most appropriate for which research contexts. When multiple levels are considered, sharp signature changes across them can provide useful information about a place's positioning at edges of ecological zones. Although providing real-time multi-level responses will require significant computing and storage capability, a one-time analysis across representative samples should provide useful guidelines for users' choice of level.
The OneEarth project, self-described as "global network of climate strategists and storytellers," has incorporated data for the 845 "widely cited" ecoregions developed by an international consortium of conservation scientists (Dinerstein, et al, 2017) into a new bioregion framework, presented in maps and essays on their web platform. Ecoregions classify the terrestrial surface into biogeographically distinct areas sharing characteristic species assemblages and ecological conditions. The spatial data for these ecoregions is freely available. Comprehensive articles describing virtually all of them, authored during an earlier World Wildlife Fund effort, are available in Wikipedia, and will be incorporated into the EDOPS prototype as optional contextual outputs alongside numerical signatures.
6. Validation: do the signatures capture something real?
EDOPS signatures represent computable and configurable summarizations of environmental conditions at given locations utilizing rigorously developed data. In effect EDOP is a model of suitability for human occupation and settlement, which must itself must be validated. How do EDOP signatures correspond to known human settlements and regions of transitory occupation? The required methodology is similar to that used by ecologists in species distribution modeling (SDM) and by archaeologists predicting likely settlement locations from environmental variables.
Attempts to predict known settlement locations are sure to have mixed results, because humans have adapted to a great variety of environmental settings. The test is simple in principle: do environmentally favorable locations correspond to where people actually settled? Defining 'favorable' independently of the settlement record itself is the methodological challenge --one the planned validation study will address using held-out data and established SDM techniques. Failure is diagnostic, success will build confidence in the model. The residuals—differences between predicted settlement probability and actual settlement record—will be a more revealing aspect than matches. In cases of genuine historical absence we can ask: Was there poor connectivity to diffusion networks? Competitive exclusion? Is there an explanatory variable the current signature doesn't provide? In cases of dense or persistent settlement but an apparently unfavorable signature, were there strategic imperatives like trade or defense? Were some localized resources not captured in the model, or was it sheer historical contingency?
Existing datasets identified for use in a validation process include (i) point locations of anthropological fieldwork in indigenous societies in D-PLACE, (ii) polygon geometry for over 800 temporally scoped historical polities, from the recent Cliopatria dataset developed by the Seshat Global History Databank project, and (iii) temporally scoped point locations for roughly 1700 historical settlements spanning 6,000 years, developed by Reba, et al (2016).
One important caveat is that given the dimensions of the current EDOP model, signatures are most likely to be predictive of fixed settlements relying on terrestrial resources. Hence there will be blind spots that need to be accounted for. We can expect signatures across the Eurasian steppe would read as unfavorable, despite it having been occupied intensively by mobile cultures whose movement was adaptive to apparently hostile conditions. Likewise, the terrestrial signature for Tierra del Fuego is undoubtedly relatively harsh: hyper-humid and wind-battered, with low growing-season temperatures and minimal agricultural potential, yet the rich marine resources allowed the Yaghan to thrive there for millennia, and the presence of guanaco in the interior supported the Selknam societies.
7. Culture, CDOP and the larger goal
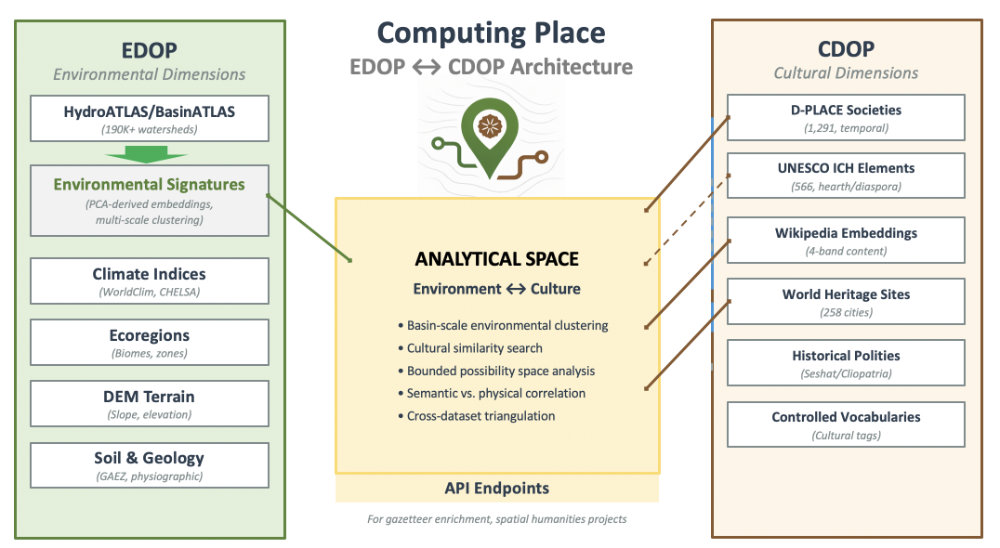
The Cultural Dimensions of Place (CDOP) component of Computing Place complements EDOP, and the exploratory and analytical space linking them requires EDOP signatures. EDOP records environmental affordances and constraints; CDOP contributes what cultures have done within particular physical settings (Fig 1). CDOP work has begun by identifying and preparing spatialized datasets representing cultural phenomena of various kinds.
These core datasets, mentioned above as being integral to EDOP signature validation work, will see further use in seeking patterns of co-relation:
D-PLACE: "...contains cultural, linguistic, environmental and geographic information for over 1400 human 'societies'. A 'society' in D-PLACE represents a group of people in a particular locality, who often share a language and cultural identity.
Cliopatria: "...a comprehensive open-source [temporally scoped] geospatial dataset of worldwide states, political groups, events, and rulers from 3400BCE to the present day. It is part of the Seshat Global History Databank project."
Chandler-Modelski historical population: "...the first spatially explicit dataset of urban settlements from 3700 BC to AD 2000..." previously published by Reba et al (2016) derived from work by Chandler and Modelski."
Experiments have begun in the Computing Place platform prototype with descriptive text for 258 UNESCO World Heritage Cities, and similar semantic embedding experiments are planned using nomination documents for Intangible Cultural Heritage listings.
The linking of EDOP and CDOP data can facilitate answering many kinds of questions, including but not limited to: Do cultural traits cluster in particular environmental regimes? How do environmental gradients correspond to linguistic, social, or economic variation? How stable are signatures across historical change?
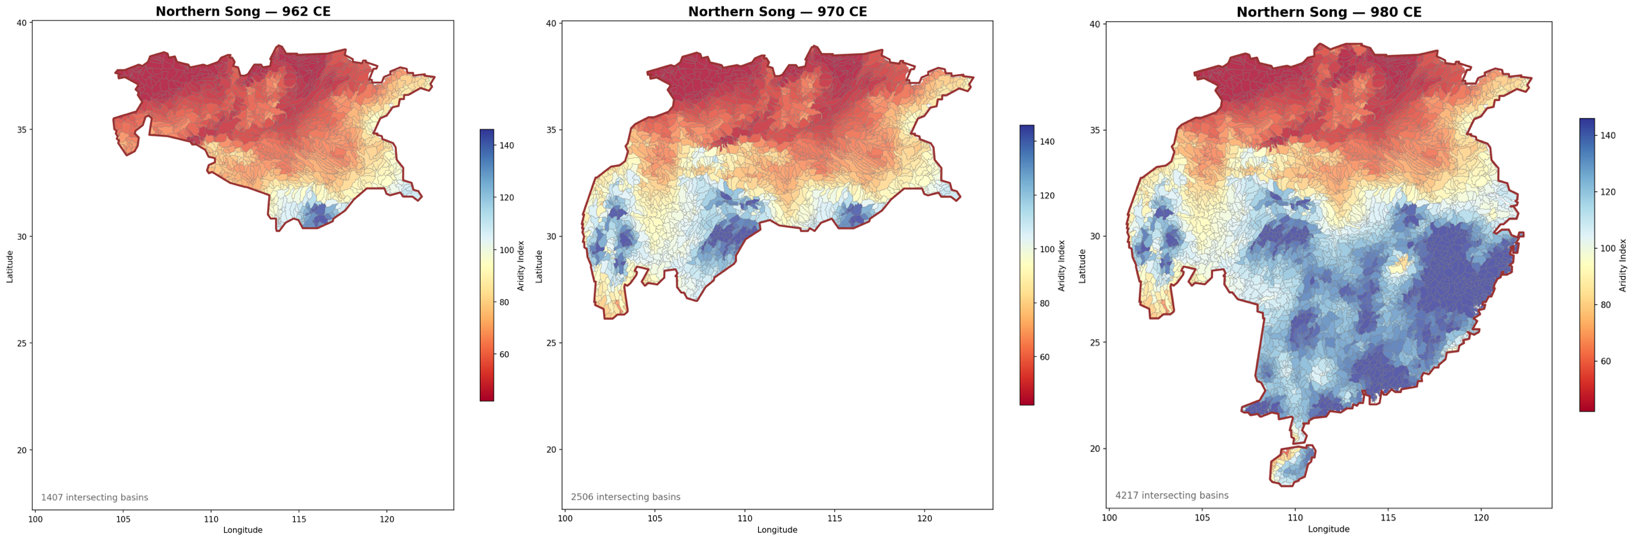
One early demonstrator developed sets of signatures for the extents of Northern Song Dynasty over an 18-year period, as recorded in the Cliopatria dataset. Mapping the aridity value of contained basins illustrates what was arguably a deliberate move to acquire more arable territory (Fig 2).
8. Current state and next steps
The Computing Place project began in early January, 2026 and produced a prototype web platform to display work-in-progress a month later at cedop.kgeographer.org/edop. Early work included developing:
-
Three ways of specifying a place to obtain a basin signature: integrated WHG toponym lookup, small (97k) internal gazetteer lookup, and selecting one of 258 World Heritage Cities (WHC).
-
Signature service returning a summary profile and full Band A-D attribute groupings per submitted place.
-
Tool for finding and mapping cities with similar profiles in the WHC set of 258.
-
Tool for browsing and mapping basin type clusters developed with principal components analysis.
-
Tool for drilling down through the OneEarth bioregion/ecoregion hierarchy, displaying maps, and at the ecoregion level, Wikipedia summary descriptions.
-
Experimental interface to D-PLACE data, mapping societies according to two of the many dimensions of its data: dominant subsistence and high gods.
-
Search/browse for World Heritage Cities, returning signatures and optional lookup of cities with similar EDOP signatures and semantic content derived from Wikipedia article embeddings for four themes: environment, history, culture, and 'modern'.
-
A public API exposing documented endpoints
Next steps
Refining the EDOP component of Computing Place is now the top priority--work that includes three efforts mentioned earlier: studies of scale sensitivity and upstream/downstream distance weighting, and validation against settlement datasets.
EDOP is intended to have broad utility to researchers in several disciplines, and ideally will be supported on a permanent basis by one or more institutions with that capability and inclination. Inquiries are being made.
Feedback is most welcome on either of the Computing Place components, as well as on the overall project. A more technical overview is available on request.
In closing
"An ordered presentation of the landscapes of the earth is a formidable undertaking." -- Carl Sauer (1925)
"Nothing for it but to do it" -- Karl Grossner (2026)
Computing Place is admittedly ambitious, perhaps overly so. It is driven by personal research questions about culture and geography that require a way of summarizing environmental settings efficiently but robustly--namely EDOP--so that is where the initial focus is. The CDOP work is so far only meanderings, a search for patterns that may or may not lead to empirical findings and even theory. But first things first, as the saying goes.
References
Dinerstein, E., Olson, D., Joshi, A., Vynne, C., Burgess, N. D., Wikramanayake, E., & Saleem, M. (2017). An ecoregion-based approach to protecting half the terrestrial realm. BioScience, 67(6), 534-545.
Goodchild, M. F. (2026, February). Personal communication.
Reba, M., Reitsma, F., & Seto, K. C. (2016). Spatializing 6,000 years of global urbanization from 3700 BC to AD 2000. Scientific data, 3(1), 160034.