 kgeographer Karl Grossner, PhD
Linked Paths
Screenshots
Platform
Organization
KGEO Research (that's me) — personal research prototype
Roles
Creator; Sole Developer
Technologies
Mapbox.js (Leaflet); D3.js (timeline, histogram, force-directed graph); Elasticsearch + Typeahead/Bloodhound; Bootstrap; jQuery; Handlebars; Grunt/Browserify/Babel; Python (data build); GeoJSON-T
Description
Linked Paths is a personal research prototype, built in 2017–18, for visualizing and analyzing historical geographic movement. It was designed specifically to test and demonstrate GeoJSON-T, an experimental extension to GeoJSON I was developing for representing temporal movement data and the records of historical gazetteers — the same format that went on to mature into the Linked Places Format (LPF), now the core data model of the World Historical Gazetteer.
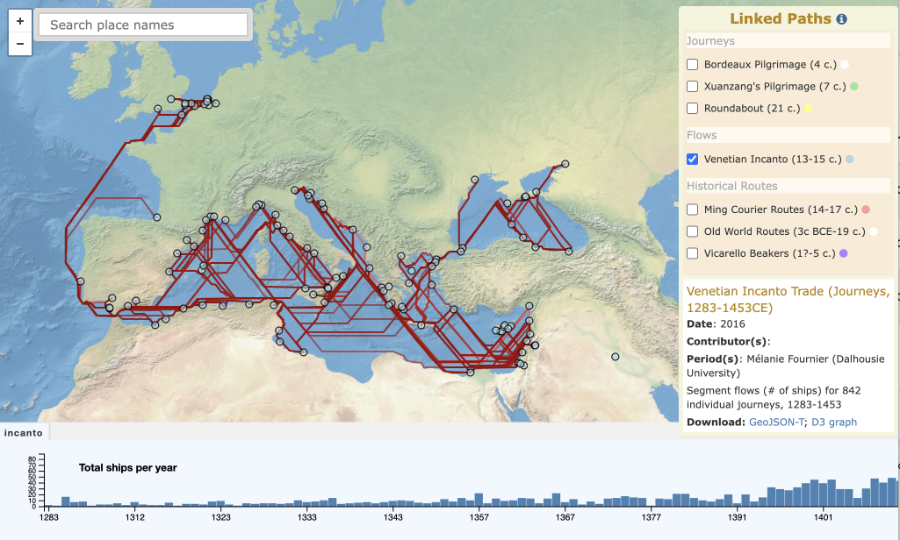
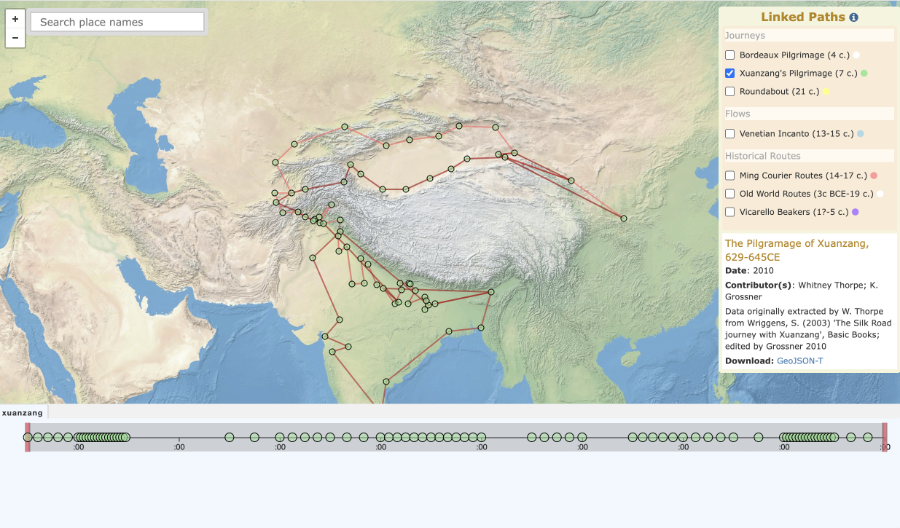
The application organizes historical datasets into three distinct categories of movement: journeys (individual travel, such as the 4th-century Bordeaux Pilgrim and Xuanzang's 7th-century pilgrimage to India), flows (repeated movement between nodes, such as the Venetian Incanto galley trade of 1283–1453), and historical routes (named route systems, including the Ming Courier Routes and Old World Trade Routes). Each dataset type drives its own tailored timeline — an event timeline, a period timeline, or a histogram — built with D3.js alongside a Mapbox/Leaflet map, with place search powered by a local Elasticsearch index.
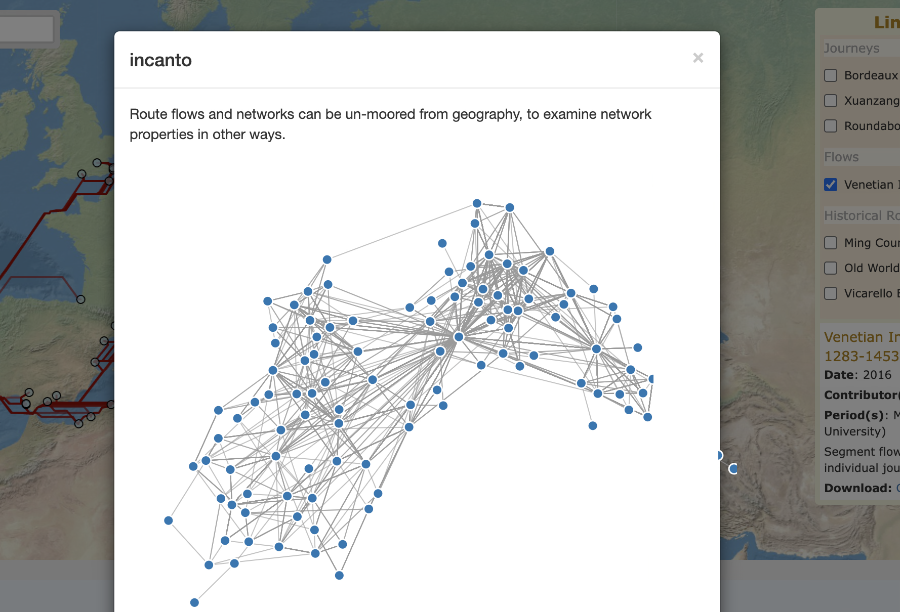
GeoJSON-T's structure means a flow or network's relations can be read independent of its geography — a connection graph of what links to what, not just a map of where. The app demonstrates this directly: pick a flow dataset, such as the Venetian Incanto trade, and it renders as a force-directed graph, detached entirely from the map. For a solo side project built with 2017-era tooling (Grunt, Browserify, Mapbox.js v3), it previewed analytical capabilities that wouldn't become standard in historical GIS tools for years afterward.